In September 1854, 600 residents of London’s Golden Square died from an infamous outbreak of cholera. It was no coincidence that this occurred in one of London’s poorest neighborhoods. We now know that markers of poverty—higher population densities, decreased nutrition, lack of medical care, and poorer sanitation (including one befouled well in particular)were associated with increased numbers of cholera deaths. Over the next 160 years, studies of public health have reinforced a clear link between poverty and health, which is now playing out on a global scale.
The Ebola virus has claimed the lives of over 8,000 residents of Sierra Leone, Guinea, and Liberia. These West African countries are among the world’s poorest. Each has more than 50 percent of its population living below the national poverty line, placing them among the poorest 10 percent of all countries. Just as with cholera in London, it is also no coincidence that the countries experiencing the largest Ebola outbreak on record are among the most impoverished.
But the poverty in these countries does not tell the whole story. The neighboring nation of Nigeria has had numerous imported Ebola cases and localized transmission, but has efficiently and effectively prevented a larger epidemic. Yet 47 percent of Nigerians also live below the national poverty level, and the country spends a comparable amount on healthcare per capita as Sierra Leone, Guinea, and Liberia. Why has Nigeria been able to successfully snuff out its flare-ups, while the outbreak continues to rage on in three neighboring countries?
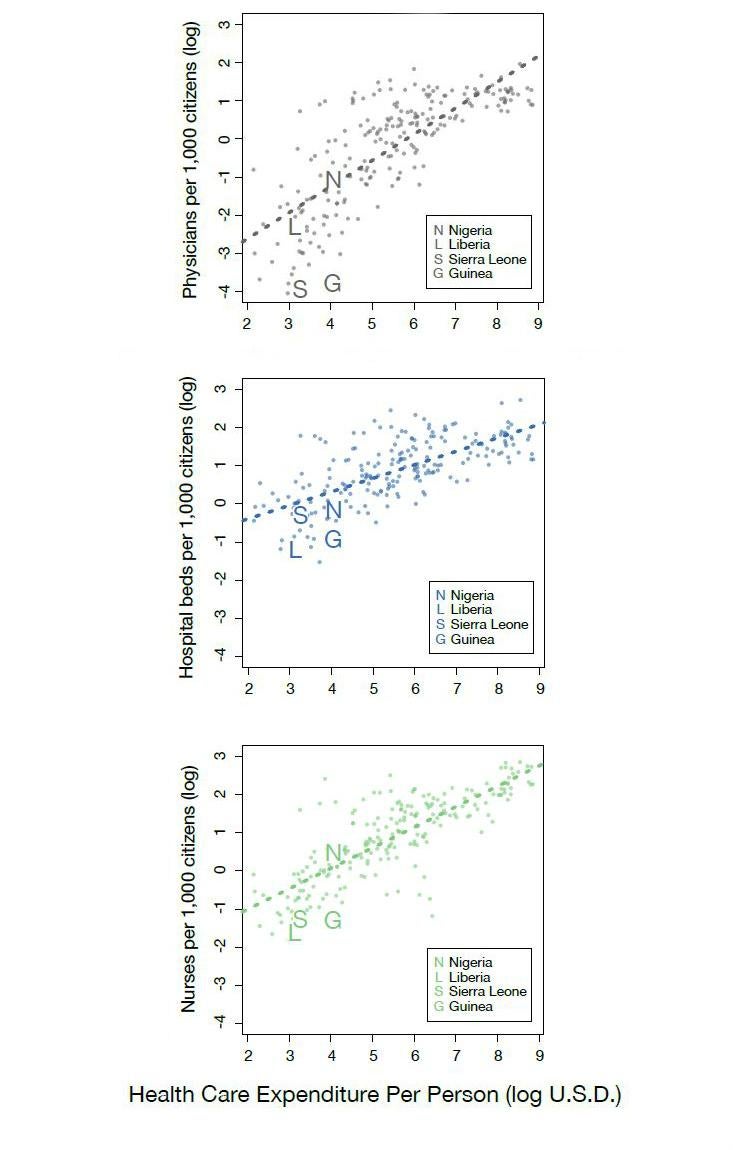
It seems that even among countries that spend similar amounts on healthcare, there are important differences in how well that money is used to protect and improve health. Sierra Leone, Liberia, and Guinea together have fewer physicians, nurses, and hospital beds per capita than 95 percent of the world’s countries. Prior to the Ebola outbreak, these countries had only 0.5 hospital beds, 0.25 nurses, and 0.05 physicians for every 1,000 people. (See graphs below.) Strikingly, the worldwide averages are 6.5 times higher for the number of hospital beds, 15 times higher for the number of nurses, and 33 times higher for the number of physicians. That means for a country of 6 million people—the average size of these countries—there are only about 300 physicians, whereas the average world country of similar size would have more than 8,000 physicians.
Nigeria, on the other hand, has more than 7 times as many physicians, 6.5 times as many nurses, and 1.8 times as many hospital beds than its neighboring counties afflicted by the Ebola outbreak—despite spending approximately the same amount of money per capita. A similar argument holds true for the Democratic Republic of Congo, Uganda, and Congo: Each country has on average 3 times as many physicians as Sierra Leone, Guinea, and Liberia (again, despite similar expenditures), and each has prevented numerous bouts of Ebola from becoming widespread.
This suggests a complicated picture, whereby Guinea, Sierra Leone, and Liberia appear less adept at translating healthcare spending into healthcare infrastructure. Part of the explanation likely stems from government corruption, a category where all three countries rank in the bottom half of countries as ranked by Transparency International. However, Nigeria, which has a more successful track record of turning money into infrastructure, has a dismal corruption rank, well behind Sierra Leone’s and Liberia’s, and only marginally ahead of Guinea’s. It is likely that there are numerous other factors that hinder these countries’ efforts to translate spending into beds and healthcare workers, with one especially significant example being the devastating effects of recent civil wars.
How to stop Ebola is not a mystery. Preventing introduced cases from sparking an epidemic seems to require only marginally more money and healthcare than is present in Guinea, Sierra Leone, and Liberia. But the substandard efficiency of healthcare infrastructure in these countries suggests that improving the situation in each country will require substantial financial and logistical resources. If we assume that Nigeria’s healthcare per capita health expenditures are sufficient to fund a healthcare system capable of stopping Ebola, each of the three countries would have needed only an additional $140 million to match this spending, or less than $500 million total. However, if we apply a discounting factor based on the empirically observed ability of these countries to convert spending to infrastructure, the needed funding may in reality be as high as $1.7 billion. Although that sounds like a large number, consider that our politicians spent around $3.6 billion on 2014 midterm election campaign costs. Could we not devote 50 percent of the spending on one mid-term election to help stop an Ebola outbreak—one that has claimed thousands of lives and inflicted billions of dollars of cost on the world economy?

Note also the diminishing returns in terms of physicians (the plotted points go up steeply on the left side of the graph but then flatten out at the right side), but also that there is a fairly strong scaling relationship between expenditure and per capita hospital beds and nurses (the points continue increasing across the entire plot).
Samuel V. ScarpinoSamuel V. Scarpino is an Omidyar Fellow at the Santa Fe Institute.


