

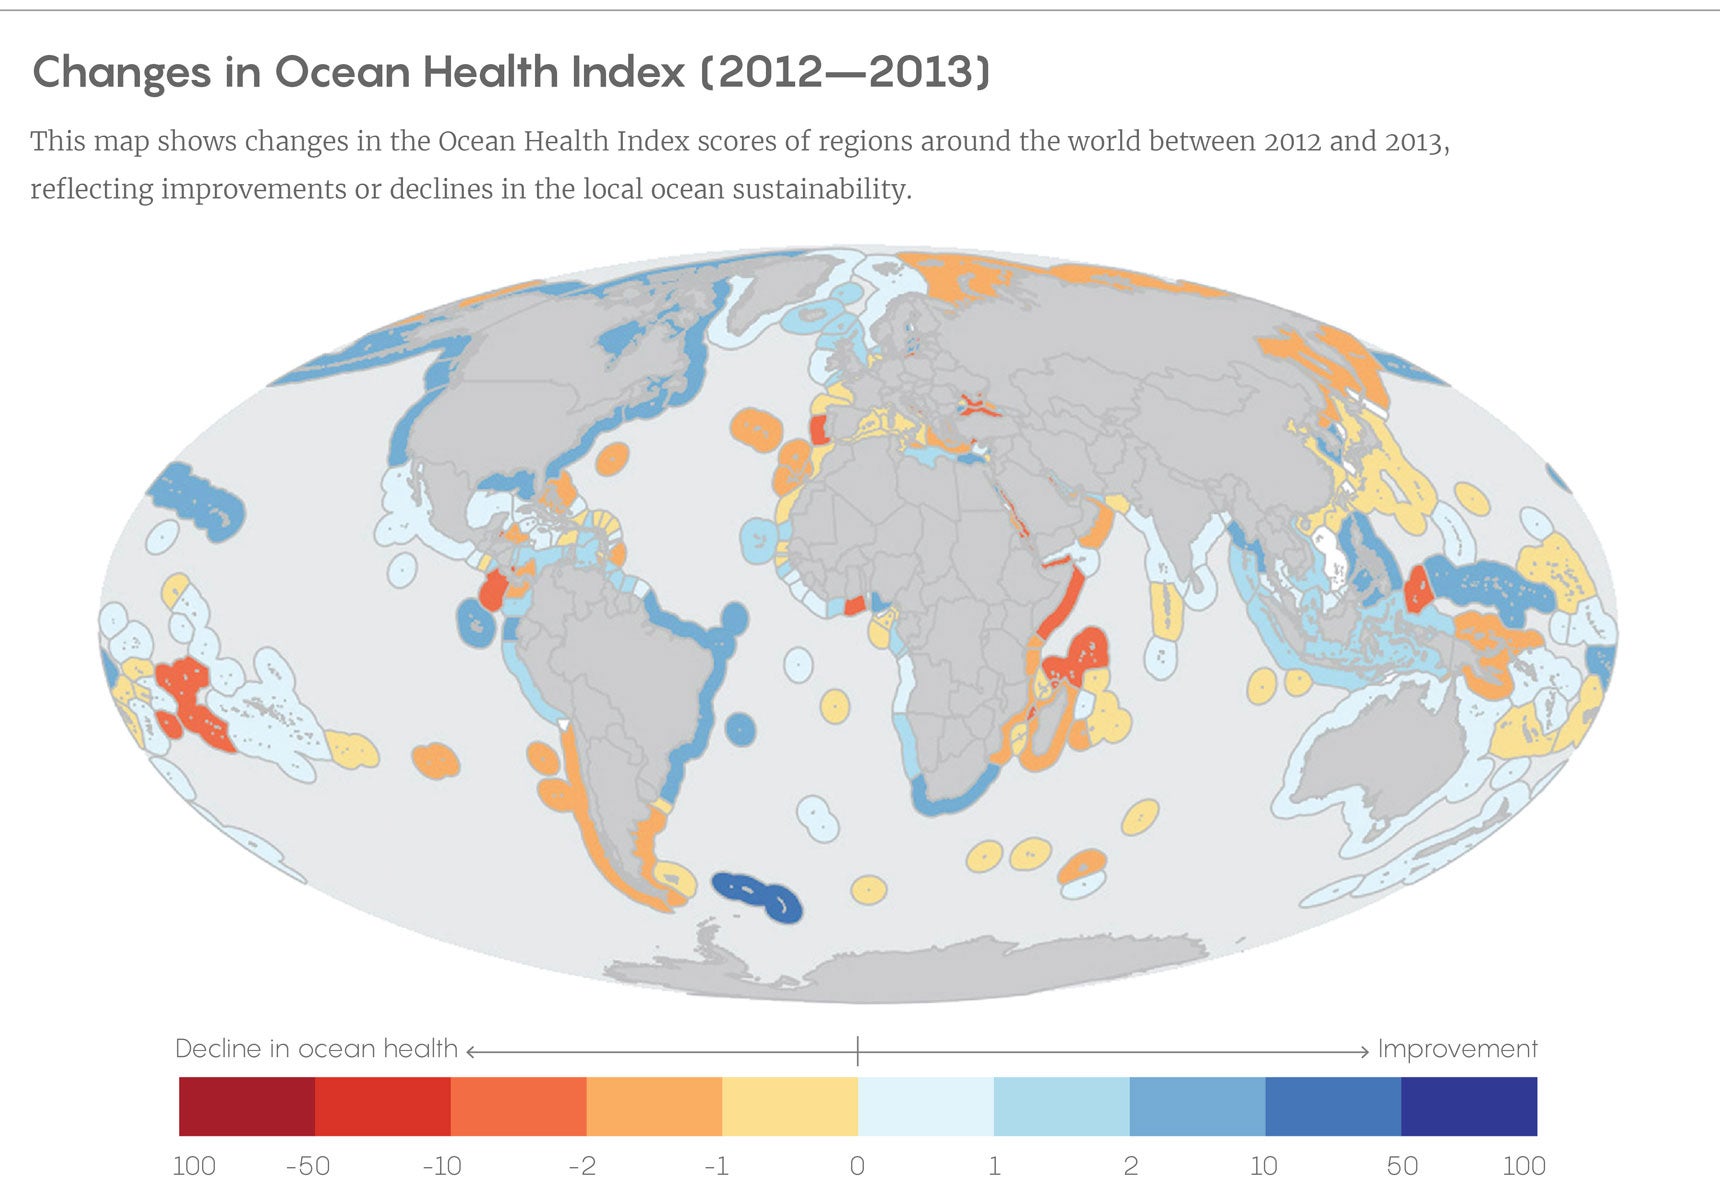
When marine ecologists released the Ocean Health Index(OHI) for the first time in 2012, it was a majestically ambitious achievement. The index, born of a collaboration among dozens of scientists, economists, and environmental managers at the National Center for Ecological Analysis and Synthesis (NCEAS) of the University of California, Santa Barbara, and the nonprofit organization Conservation International, was designed as a comprehensive framework for scientifically evaluating the health of ocean ecosystems, both worldwide and regionally. Drawing on more than a hundred databases, the index pulled together local measurements of biodiversity and ecological productivity with information about fishing, industrial use, carbon storage, tourism, and other factors to score the health of open ocean and coastal regions between 0 and 100. (The global ocean earned a score of 60 in that first year, with regional ratings between 36 and 86.) The authors of the index hoped that such a standardized basis of comparison between and within regions would help with identifying and communicating the most effective measures for protecting the oceans and with guiding policymakers toward better decisions.
But the value in such an index comes not from doing it once but being able to do it over and over again. When the OHI team took up the task again in 2013, they quickly hit snags: Their data sets, documentation, and modeling procedures were still an ugly mess. The OHI team had wrangled the motley data into shape for the 2012 results, but they were having trouble reproducing their own work as they revisited it for the update.
Reproducibility has become a hot-button topic for the biomedical sciences and psychology in recent years, but those fields aren’t alone. Environmental scientists have warned repeatedly that problems with reproducibility and transparency could become increasingly dire as researchers embrace big data approaches to understanding the dynamics of ecosystems at scales ranging from the regional to the continental or even larger—an effort often called macrosystems ecology.
Now an essay published this week by Julia S. Stewart Lowndes of NCEAS and her colleagues about how the OHI team quietly overcame its ungainly data problem offers an interesting case study in how macrosystems ecology projects—and even more modestly focused research—can benefit from an open access makeover. Their story also offers a how-to for researchers who might like to follow their example.
“I want other people to see this as their own future and feel empowered by it,” Lowndes said.
Big data projects in the environmental sciences go back for at least half a century, to the International Biological Program of the mid-1960s and ’70s. Often they have met with skepticism from ecologists and other biologists who complained that the projects sometimes seemed unfocused or that they locked investigators into awkward, counterproductive collaborations. Biologists who study rare species and delicate environments have objected to the loss of control over what they considered sensitive or proprietary information.
The disparate data types used by ecologists can also be a challenge, said Stephanie E. Hampton, a marine biologist and former NCEAS deputy director who is now the director of Washington State University’s Center for Environmental Research, Education and Outreach. Genetic sequences, phylogenetic trees, land use data, remote sensing, and imagery data, logs of population numbers, and species behaviors—all these and more need to be standardized and combined in macrosystems ecology projects. “We’re all jealous of people working in genomics because they’re trying to manage just four letters,” she said, laughing. “I think ecology is the real poster child for the heterogeneity issue.”
At least part of the conflict has also been vested in the training and culture of ecologists. Researchers have been accustomed to working on their own or in relatively cozy circles of close colleagues. Because of the traditional “rugged individualist” sensibility among ecologists, researchers often developed their own ways of studying a species or habitat, Hampton said. “Typically, what we do is Frankenstein something together.” They didn’t worry much about whether their procedures or record keeping perfectly matched what scientists working in other habitats used. Indeed, researchers often felt their idiosyncratic approaches were justified by the unique features of their subjects.
“We’re trained as ecologists and environmental scientists, but we’re never really taught to work with data, so everybody just comes up with their own way,” Lowndes said.
As sharing and vetting environmental data have become bigger parts of modern ecology, however, those idiosyncrasies have become less defensible, as the OHI effort came to rue. One irony that Lowndes and her co-authors note is that while working on the 2012 index they had foreseen the reproducibility problem and had therefore documented how to handle the heterogeneous data in 130 pages of supplementary materials, which is “beyond the norm for environmental science.”
And yet, when they started again in 2013, even those reminders weren’t enough because their workflow was fundamentally inefficient. They were still copying and pasting data from all the contributing databases into Excel worksheets by hand. The logic behind the individual data processing choices in the models was often scattered across emails and other documents. “Not only did that mean we would have to walk through all those steps again ourselves, but we would have to make sure that we were doing it exactly the same way,” Lowndes said. “There was just so much room for error.”
It was bad enough that this frustrating result suggested other researchers would not be able to apply the OHI and its methods to their own work as had been intended. But the OHI team also realized that they could not even easily pick up where they had left off: They had failed as collaborators with their future selves.
To get the 2013 OHI and future installments back on track, Lowndes and the OHI team started a multi-year project of assembling an “OHI toolbox” of free, open access software that participants in the project would use to make their workflow speedier and more uniform, and the data processing choices more transparent. The decision was initially driven “out of self-preservation, because we had a lot of deadlines and needed to be more efficient,” Lowndes said. Extensive supplementary documentation would be unnecessary because background information would be built into the system. The tools had to be free, they knew, because scientists who would want to use the OHI data and develop their own local measurements in some parts of the world could not afford pricier solutions.
The OHI team therefore settled on writing all their code in the programming language R and made sure that all the code directly documented every aspect of the data preparation. The models used to generate specific assessment scores within the OHI had originally been written in several languages because of differences in the underlying data; the team replaced all those programs with new ones in R. By using the GitHub repository for these software tools, they took advantage of its built-in version control systems to ensure better organization and naming of files.
“Coding not only provides a historic record of what happened. It’s reusable,” Lowndes said. “We have scripts that will download data from a URL, and then do to that data exactly what it did to the previous year’s.” Moreover, using the same tools across models can help with communicating how it was done. The setup of the OHI compels researchers to learn and follow good, consistent practices in data science, regardless of whether they were formally trained in it.
As a result of these procedural improvements, the OHI team was able to release its 2013 update on schedule and to follow up with three more annual updates. Results of the fifth OHI were announced last December. With each iteration and refinement in the procedures, the researchers found they could do better science in less time.
One quiet sign of the success of the open data science approach for the OHI is a note on the project’s website that the 2016 global ocean health assessment score of 71 had essentially not changed since 2013. (The 2012 score has also been reevaluated as 71.) Thanks to the transparent coding in the OHI procedures, researchers could easily recalculate the previous scores by the updated methods used in 2016. The general health of the ocean may not be noticeably improving year to year, but the handling of data for studying it is.