


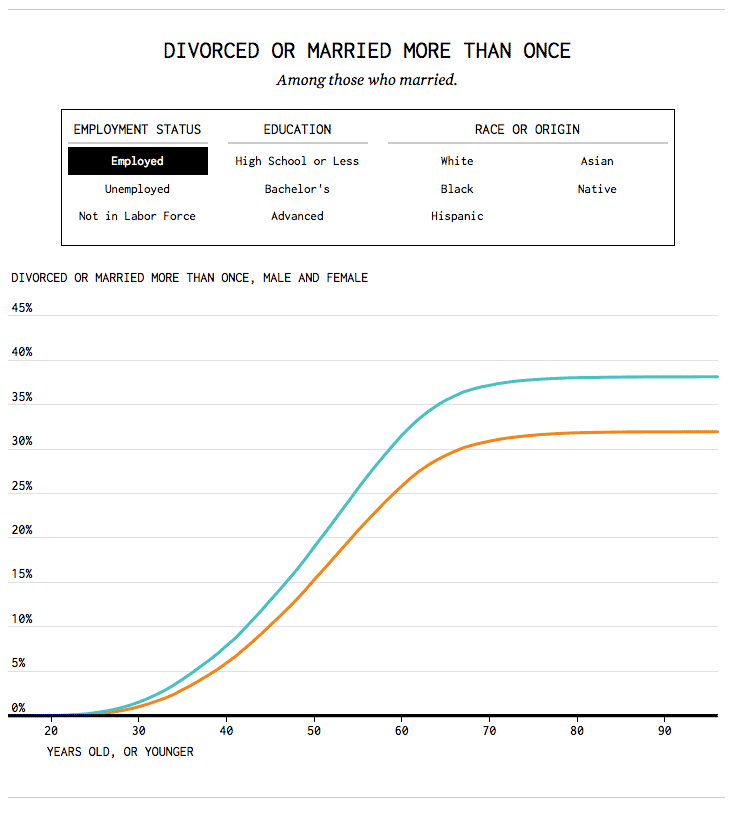
We know when people usually get married. We know who never marries. Finally, it’s time to look at the other side: divorce and remarriage. The chart below shows cumulative rates for different groups of people in the United States, based on 2014 American Community Survey, 1-year estimates.
For example, by age 60, among the employed in 2014 who married at some time in their lives, 32 percent of women and 26 percent of men either divorced or remarried.
A common myth about marriage is that half of them end in divorce. It comes from naively dividing the divorce rate by the marriage rate.
For example, based on 2014 American Community Survey, 1-year estimates, there were 8.7 divorces and 17.0 marriages per 1,000 women. Divide the former by the latter and you get 51 percent. For men, it was 8.1 and 18.1, respectively, which gives you 45 percent. The problem with this math is that the people who marry now aren’t the same people who divorce now. Claire Cain Miller for the Upshot discussed this a while back.
You can see this in the above too. No group ever goes past the 45 percent mark.
What surprised me was the differences between men and women. I expected the percentages to end up at similar values for most of the groups, but there’s some flip-flopping between men and women as you change between different demographics. There also seems to be a bigger difference between men and women among the employed and those with advanced degrees.
I’m not sure why this is. I thought that widows might increase the percentage of women who remarry, but when I looked at only those with a divorced marriage status (excluding those with a married status but married more than once), the differences increased.
So my only guess is less divorce opportunity for men. We know they tend to marry later than women and die earlier. Maybe the window is smaller? I’m totally guessing though. If anyone knows better, feel free to email or get me on Twitter.
Nerd Notes
- Tracking detailed divorce trends can be tricky. The National Center for Health Statistics provides overall national numbers. The Survey of Income and Program Participation (SIPP) used to provide detailed divorce data, but the most recent onlineis from 2009. I thought I read this was due to funding, but I can’t find the note now, so don’t quote me on that. So I went with ACS data, downloaded from the Integrated Public Use Microdata Series (IPUMS). The ACS doesn’t ask about complete marriage history though. If someone is divorced, we don’t know when or when they first married. Similarly, if someone married more than once, we only know the year of their most recent marriage and nothing about previous divorces.
- I analyzed and tabulated in R. I made the chart with d3.js.