

In an increasingly data-driven world, mathematical tools known as wavelets have become an indispensable way to analyze and understand information. Many researchers receive their data in the form of continuous signals, meaning an unbroken stream of information evolving over time, such as a geophysicist listening to sound waves bouncing off of rock layers underground, or a data scientist studying the electrical data streams obtained by scanning images. These data can take on many different shapes and patterns, making it hard to analyze them as a whole or to take them apart and study their pieces—but wavelets can help.
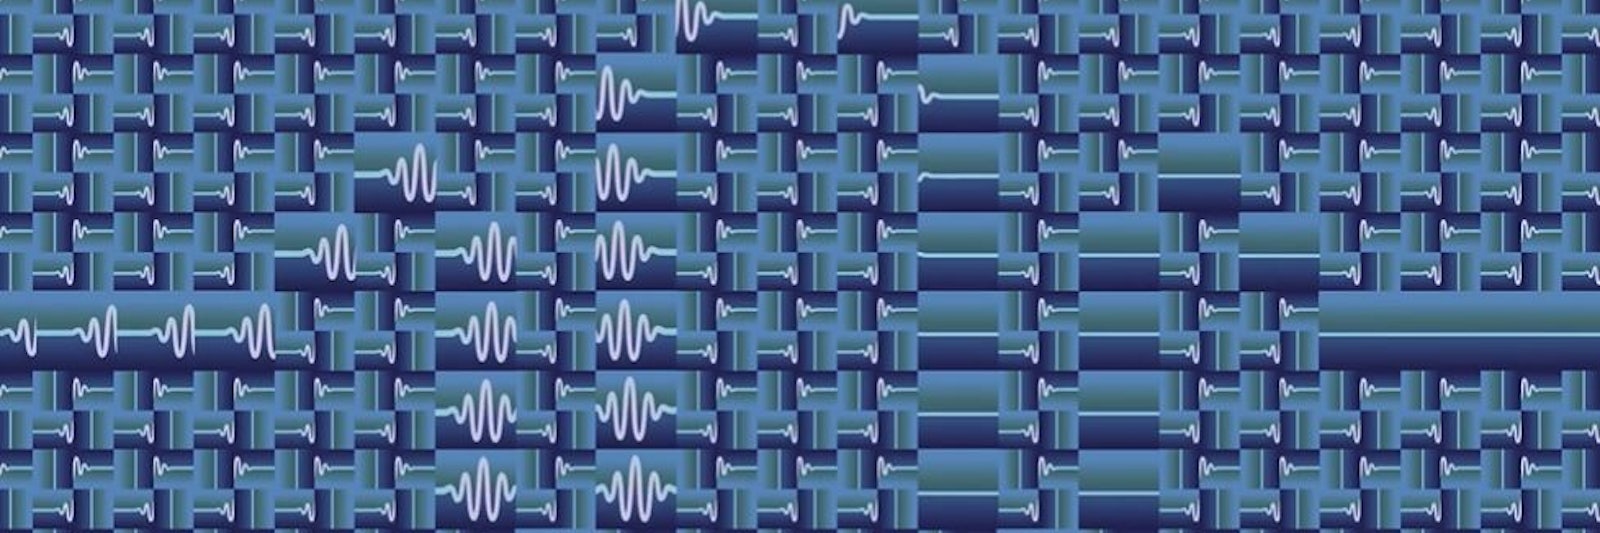
Wavelets are representations of short wavelike oscillations with different frequency ranges and shapes. Because they can take on many forms—nearly any frequency, wavelength and specific shape is possible—researchers can use them to identify and match specific wave patterns in almost any continuous signal. Because of their wide versatility, wavelets have revolutionized the study of complex wave phenomena in image processing, communication and scientific data streams.
“In fact, few mathematical discoveries have influenced our technological society as much as wavelets have,” said Amir-Homayoon Najmi, a theoretical physicist at Johns Hopkins University. “Wavelet theory has opened doors to many applications in a unified framework with an emphasis on speed, sparsity and accuracy that were simply unavailable before.”
Wavelets came about as a kind of update to an enormously useful mathematical technique known as the Fourier transform. In 1807, Joseph Fourier discovered that any periodic function—an equation whose values repeat cyclically—could be expressed as the sum of trigonometric functions like sine and cosine. This proved useful because it allows researchers to split a signal stream into its constituent parts, enabling, for instance, a seismologist to identify the nature of underground structures based on the intensity of the different frequencies in reflected sound waves.
As a result, the Fourier transform has led directly to a number of applications in scientific research and technology. But wavelets allow for much more precision. “Wavelets have opened the door to many improvements in de-noising, image restoration and image analysis,” said Véronique Delouille, an applied mathematician and astrophysicist at the Royal Observatory of Belgium who uses wavelets for analyzing images of the sun.
That’s because Fourier transforms have a major limitation: They only supply information about the frequencies present in a signal, saying nothing about their timing or quantity. It’s as if you had a process for determining what kinds of bills are in a pile of cash, but not how many of each there actually were. “Wavelets definitely solved this problem, and this is why they are so interesting,” said Martin Vetterli, the president of the Swiss Federal Institute of Technology Lausanne.
The first attempt to fix this problem came from Dennis Gabor, a Hungarian physicist who in 1946 suggested cutting the signal into short, time-localized segments before applying Fourier transforms. However, these were difficult to analyze in more complicated signals with strongly changing frequency components. This led the geophysical engineer Jean Morlet to develop the use of time windows to investigate waves, with the windows’ lengths depending on the frequency: wide windows for low-frequency segments of the signal and narrow windows for high-frequency segments.
“There are many kinds of wavelets, and you can squish them, stretch them, you can adapt them to the actual image you are looking at,” said Daan Huybrechs of the Catholic University of Leuven.
But these windows still contained messy real-life frequencies, which were hard to analyze. So Morlet had the idea of matching each segment with a similar wave that was mathematically well understood. This allowed him to grasp the overall structure and timing of these segments and explore them with much greater accuracy. In the early 1980s Morlet named these idealized wave patterns “ondelettes,” French for “wavelets”—literally, “little waves”—because of their appearance. A signal could thus be cut up into smaller areas, each centered around a specific wavelength and analyzed by being paired with the matching wavelet. Now faced with a pile of cash, to return to the earlier example, we’d know how many of each kind of bill it contained.
Roughly, imagine that you slide a particular wavelet, of a specific frequency and shape, over the raw signal. Whenever you have a particularly good match, a mathematical operation between them known as the dot product becomes zero, or very close to it. By scanning the entire signal with wavelets of different frequencies you can piece together a solid picture of the entire signal train, allowing for a thorough analysis.
Research on wavelets evolved quickly. The French mathematician Yves Meyer, a professor at the École Normale Supérieure in Paris, was waiting for his turn at a photocopier when a colleague showed him a paper on wavelets by Morlet and the theoretical physicist Alex Grossmann. Meyer was immediately fascinated and took the first available train to Marseille, where he began working with Grossman and Morlet, as well as the mathematician and physicist Ingrid Daubechies (now at Duke University). Meyer would go on to win the Abel prize for his work on wavelet theory.
A few years later, a graduate student at Pennsylvania State University studying computer vision and image analysis named Stéphane Mallat bumped into an old friend at the beach. The friend, a graduate student with Meyer in Paris, told Mallat about their research in wavelets. Mallat understood the importance of Meyer’s work for his own research right away, and quickly teamed up with Meyer. In 1986 they produced a paper on the application of wavelets in image analysis. Ultimately, this work led to the development of the JPEG2000, a form of image compression in use around the world. The technique analyzes the signal of a scanned image with wavelets to produce a collection of pixels that is overall much smaller than the original image while still allowing the reconstruction of the image with the original resolution. This technique proved valuable when technical constraints limited the transmission of very large data sets.
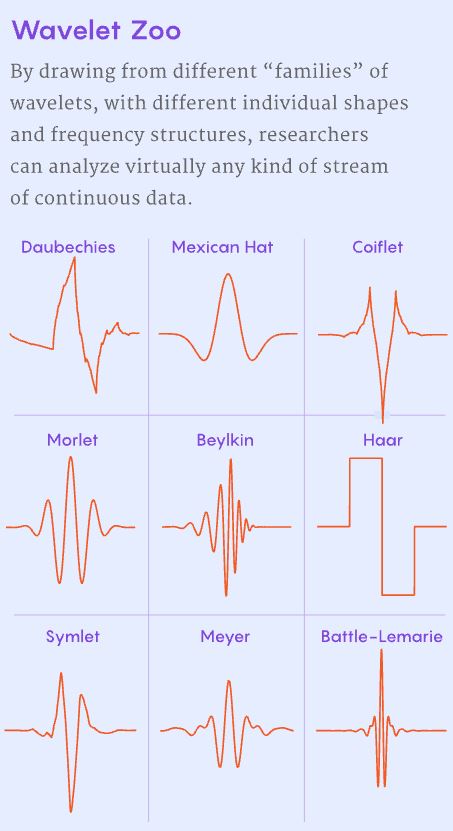
Part of what makes wavelets so useful is their versatility, which allow them to decode almost any kind of data. “There are many kinds of wavelets, and you can squish them, stretch them, you can adapt them to the actual image you are looking at,” said Daan Huybrechs, a mathematical engineer at the Catholic University of Leuven in Belgium. The wave patterns in digitized images can differ in many aspects, but wavelets can always be stretched or compressed to match sections of the signal with lower or higher frequencies. The shapes of wave patterns can also change drastically, but mathematicians have developed different types, or “families,” of wavelets with different wavelength scales and shapes to match this variability.
One of the best-known wavelet families is the Daubechies mother wavelet, whose members have a self-similar fractal structure, with large asymmetrical peaks mimicking smaller replications of the peaks. These wavelets have proved so sensitive to image analysis that experts have used them to distinguish original Vincent van Gogh paintings from forgeries. Other wavelet families known for their shapes include the Mexican hat, with one central maximum and two adjacent minima, and the Coiflet wavelet (named after the mathematician Ronald Coifman at Yale University), similar to the Mexican hat but with sharp peaks instead of flat zones. These are useful for capturing and eliminating unwanted noise spikes in images, sound signals and data streams generated by scientific instruments.
Besides their use in analyzing sound signals and in image processing, wavelets are also a tool in basic research. They can help researchers discover patterns in scientific data by allowing them to analyze entire data sets at once. “It always strikes me how diverse the applications are,” said Huybrechs. “There is something about wavelets that makes them the ‘right’ way to look at data,” and that’s true no matter what kind of data it is.
Lead image: Ana Kova/Quanta Magazine