How rich, creative, or safe can we expect a city to be? How can we establish which cities are the most innovative, the most violent, or the most effective at generating wealth? How do they rank according to economic activity, the cost of living, the crime rate, the number of AIDS cases, or the happiness of their populations?
The conventional answer is to use simple per capita measures as performance indices and rank order of cities accordingly. Almost all official statistics and policy documents on wages, income, gross domestic product (GDP), crime, unemployment rates, innovation rates, cost of living indices, morbidity and mortality rates, and poverty rates are compiled by governmental agencies and international bodies worldwide in terms of both total aggregate and per capita metrics. Furthermore, well-known composite indices of urban performance and the quality of life, such as those assembled by the World Economic Forum and magazines like Fortune, Forbes,1 and The Economist,2 primarily rely on naive linear combinations of such measures.
But, since we have quantitative scaling curves for many of these urban characteristics and a theoretical framework for their underlying dynamics, we can do much better in devising a scientific basis for assessing performance and ranking cities.

The ubiquitous use of per capita indicators for ranking and comparing cities is particularly egregious because it implicitly assumes that the baseline, or null hypothesis, for any urban characteristic is that it scales linearly with population size. In other words, it presumes that an idealized city is just the linear sum of the activities of all of its citizens, thereby ignoring its most essential feature and the very point of its existence, namely, that it is a collective emergent agglomeration resulting from nonlinear social and organizational interactions. Cities are quintessentially complex adaptive systems and, as such, are significantly more than just the simple linear sum of their individual components and constituents, whether buildings, roads, people, or money. There is an approximately 15 percent increase in all socioeconomic activity with every doubling of the population size, which happens almost independently of administrators, politicians, planners, history, geographical location, and culture.
New York City turns out to be quite an average city.
In assessing the performance of a particular city, we therefore need to determine how well it performs relative to what it has accomplished just because of its population size. By analogy with the discussion on determining the strongest champion weight lifter by measuring how much each deviated from his expected performance relative to the idealized scaling of body strength, one can quantify an individual city’s performance by how much its various metrics deviate from their expected values relative to the idealized scaling laws. This strategy separates the truly local nature of a city’s organization and dynamics from the general dynamics and structure common to all cities. As a result, several fundamental questions about any individual city can be addressed, such as how exceptional it is relative to its peers, what timescales are relevant for local policy to take effect, what are the local relationships between economic development, crime, and innovation, to what extent is it unique, and to what extent can it be considered a member of a family of like cities.

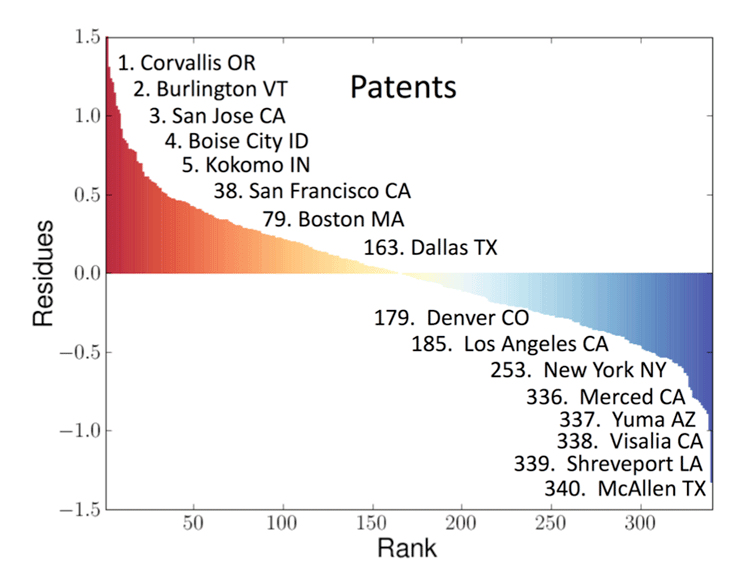
My colleagues Luis, José, and Debbie carried out such an analysis for the entire United States urban system consisting of 360 Metropolitan Statistical Areas (MSAs) for a suite of metrics.3 A sample of the results is presented in Innovation in Cities (above), where the deviations from scaling for personal income and patent production for cities in the U.S. in 2003 are plotted logarithmically on the vertical axis against the rank order of each city. We called these deviations Scale-Adjusted Metropolitan Indicators (SAMIs). The horizontal axis across the center of these graphs is the line along which the SAMI is zero and there is no deviation from what is predicted from the size of the city. As can be seen, every city deviates to some extent from its expected values. Those to the left denote above-average performance, whereas those to the right denote below-average performance. This provides a meaningful ranking of a city’s individuality and uniqueness beyond what is effectively guaranteed just because it’s a city of a certain size. Without delving into details of this analysis, I want to make a few salient points about some of the results.
First, compared with conventional per capita indicators, which place seven of the largest 20 cities in the top 20 in terms of their GDPs, our science-based metrics rank none of these cities in the top 20. In other words, once the data are adjusted for the generic superlinear effects of population size, these cities don’t fare so well. Mayors of these cities who take credit and boast that their policies have led to economic success as evidenced by their city’s being near the top of the per capita GDP rankings are therefore giving a misleading impression.
Amusingly from this point of view, New York City as a whole turns out to be quite an average city, marginally richer than its size might predict (rank 88th in income, 184th in GDP), not very inventive (178th in patents), but surprisingly safe (267th in violent crime). On the other hand, San Francisco is the most exceptional large city, being rich (11th in income), creative (19th in patents), and fairly safe (181st in violent crime). The truly exceptional cities are typically smaller, such as Bridgeport for income (due to all those bankers and hedge fund managers from New York City living in the suburbs); Corvallis (home of a Hewlett-Packard research lab and a respectable university, Oregon State), and San Jose (which encompasses Silicon Valley—what more need be said?) for patents; and Logan (the Mormon culture?) and Bangor (who knows?) for safety.
Besides being safe, New York City does distinguish itself another way: In New York the most abundant business type is offices of physicians. Weird, especially because physicians are ranked only fifth in Phoenix, which has a huge retirement community of decrepit old farts like me, and seventh in San Jose, which is possibly less surprising given all those young obsessive-compulsive California joggers and health enthusiasts.
Just as with other metrics, the types of businesses that a city hosts scale according to universal laws with the size of the city. While all cities necessarily have a similar essential core of businesses—lawyers, doctors, restaurants, garbage collectors, teachers, administrators, and so on—only a very few have specialized subcategories such as maritime lawyers, tropical disease doctors, blacksmiths, chess store proprietors, nuclear physicists, and hedge fund managers. The deviation of a city’s business types from what is expected based on universal scaling laws is then a reflection of its individuality and distinctive characteristics.
Diversity systematically increases with population size.
The challenge of formally categorizing businesses has been addressed, at least in North America, by the compilation of an extraordinary data set that includes the records of almost all business establishments in the U.S. (more than 20 million). This is the result of an impressive collaboration between the United States, Canada, and Mexico, and is called the North American Industry Classification System (NAICS). An establishment is just any single physical location where business is conducted. Consequently, individual businesses that are part of a national chain, such as a Walmart store or a McDonald’s franchise, would be counted as separate establishments. Establishments are often viewed as the fundamental units of economic analysis because innovation, wealth generation, entrepreneurship, and job creation all manifest themselves through the formation and growth of such workplaces. The NAICS classification scheme employs a six-digit code at the most detailed industry level. The first two digits designate the largest business sector, the third digit designates the subsector, and so on, thereby capturing economic life at an extraordinarily fine-grained level.
My colleagues Luis, José, and Debbie carried out an analysis of these data with our postdoc Hyejin Youn1 taking the lead role. As we saw in the analysis of other urban metrics, the data reveal surprisingly simple and unexpected regularities. For instance, the total number of establishments in each city regardless of what business they conduct turns out to be linearly proportional to its population size. Double the size of a city and on average you’ll find twice as many businesses. The proportionality constant is 21.6, meaning that there is approximately one establishment for about every 22 people in a city, regardless of the city size. Or to put it slightly differently, on average a new workplace is created each time the population of a city increases by just 22 people, whether in a small town or a large metropolis. This is an unexpectedly small number and usually comes as quite a surprise to most people, even those dealing in business and commerce. Similarly, the data also show that the total number of employees working in these establishments also scales approximately linearly with population size: On average, there are only about eight employees for every establishment, again regardless of the size of the city. This remarkable constancy of the average number of employees and the average number of establishments across cities of vastly different sizes and characters is not only contrary to previous wisdom, but also rather puzzling when viewed in light of the pervasive superlinear agglomeration effects that underlie all socioeconomic activity including per capita increases in productivity, wages, GDP, and patent production.4
To get a deeper understanding of this and to reveal the business character of a city, it’s illuminating to ask how many different types of businesses there are in a city. This is like asking how many different species of animals there are in an ecosystem. The simplest coarse-grained measure of economic diversity of a city is obtained by just counting the number of distinct types of establishments it has as a function of its population size. The data confirm that diversity systematically increases with population size at all levels of resolution, as defined by the NAICS data set. Unfortunately, the classification scheme is unable to capture the full extent of economic diversity in the largest cities because it is unable to differentiate among very closely related types of establishments such as, for instance, between a northern and southern Italian restaurant. However, an extrapolation of the data strongly suggests that if we could measure diversity to the finest possible resolution it would scale logarithmically with city size.
Compared with the usual canonical power law behavior that most metrics obey, this represents an extremely slow increase with population size. For instance, an increase of the population by a factor of 100 from, say, 100,000 to 10 million results in the addition of 100 times as many businesses but an increase of only a factor of two in their diversity. To put it slightly differently: Doubling the size of a city results in doubling the total number of establishments, but only a meager 5 percent increase in new kinds of businesses. Almost all of this increase in diversity is reflected in a greater degree of specialization and interdependence involving larger numbers of people, both as workers and as clients. This is an important observation because it shows that increasing diversity is closely linked to increasing specialization, and this acts as a major driver of higher productivity following the 15 percent rule.
On average a new workplace is created each time the population of a city increases by just 22 people.
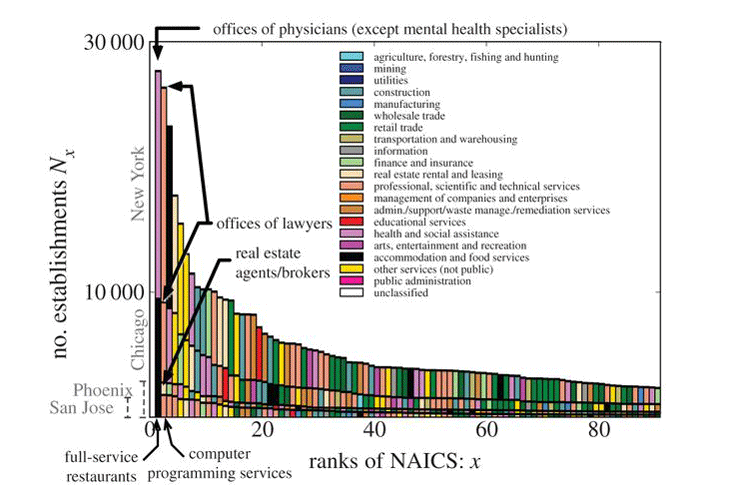
A more detailed way of assessing economic diversity is to dig deeper and examine the specific component types of establishments that constitute the business landscape of individual cities. How many lawyers, doctors, restaurants, or contractors are there in each city, and how many of these are corporate lawyers, orthopedic surgeons, Indonesian restaurants, or plumbing contractors? As an example of such an analysis, City Business (below) shows the abundances of the 100 leading business types for a selection of cities in the U.S. These are plotted in a classic rank-size format. When giving a talk, I preface the showing of this graph by asking the audience what they think is the most abundant business type in New York City. So far, no one has yet come up with the correct answer, including audiences of business and corporate gurus operating in New York City itself. It’s amazing what you can learn from taking a simple analytic, principled approach to problems.

The answer, as mentioned, is physicians. Less surprising is that after physicians, the next highest ranked in New York are offices of lawyers, followed by restaurants. In fact, restaurants rank high in all cities, being first, for example, in Chicago, Phoenix, and San Jose. Eating out, whether at a fancy Four Seasons restaurant or at a McDonald’s fast-food stop, is clearly a major component of the socioeconomic activity of Americans. More generally, it’s interesting to speculate what these sorts of rankings say about a city. For instance, after restaurants Phoenix ranks real estate second, which is perhaps not surprising in a rapidly growing city, whereas San Jose, the home of Silicon Valley, predictably ranks computer programming second.
It’s obvious why lawyers and restaurants would rank high in New York, but what is it about New York that there should be such a large abundance of doctors? Is life in the Big Apple that stressful and unhealthy? If you find this intriguing, you can see the analogous decomposition of economic activities in your favorite city in the supplementary material to our paper posted on the Web. Clearly, for those running a city or thinking about its future or investing in its development, knowing these sorts of details about the composition of their business landscape provides an important input.
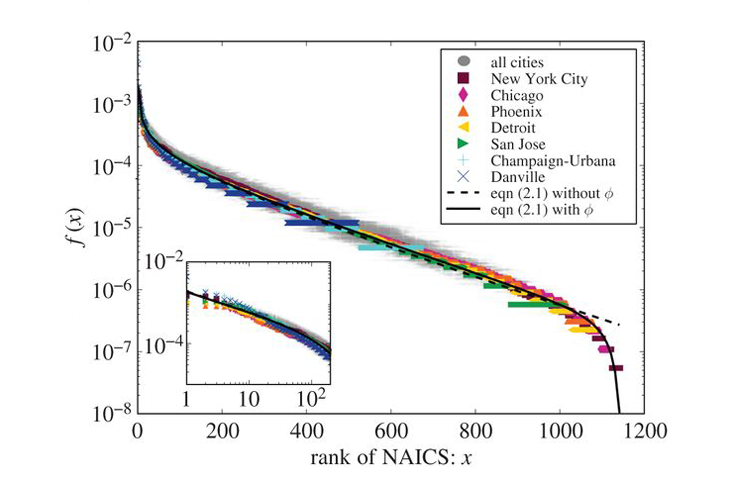
In contrast to the inherent universal properties of cities that are manifested in the scaling laws, these rank-size distributions of business types reflect a unique fingerprint of the city. They are the hallmark of each city and obviously do depend on its history, geography, and culture. It is therefore all the more remarkable that, despite the unique admixture of business types for each individual city, the shape and form of their distribution is mathematically the same for all of them. So much so, in fact, that with a simple scale transformation inspired by theory their rank abundances collapse onto a single unique universal curve common to all cities, as shown explicitly in Business Types (below). When one considers the vast range of income, density, and population levels, let alone the uniqueness and diverse cultures that vary so widely in cities across the U.S., this universality is quite surprising.

What is particularly satisfying is that this unexpected universality, as well as the actual form of the universal curve and the logarithmic scaling of diversity, can all be derived from theory. The universality is driven by the constraint that the sum total of all the different businesses in a city scales linearly with population size, regardless of the detailed composition of business types or of the city. The snakelike mathematical form of the actual distribution function in the chart can be understood from a variant of a very general dynamical mechanism that has been successfully used for understanding rank-size distributions in many different areas, ranging from words and genes to species and cities. It goes under many different names including preferential attachment, cumulative advantage, the rich get richer, or the Yule-Simon process. It is based on a positive feedback mechanism in which new elements of the system (business types in this case) are added with a probability proportional to the abundances of how many are already there. The more there are, the more of that type are going to be added, so more frequent types get even more abundant with increasingly higher probability than less frequent types.5, 6, 7
This may be one of the most important universal scaling laws for cities. Successful companies and universities attract the smartest people, resulting in their becoming more successful, thereby attracting even smarter people, leading to even greater success and so on, just as wealthy people attract favorable investment opportunities that generate even more wealth which they further invest to get even more wealthy. Hence the catchphrase the rich get richer and its implied, but usually unstated, corollary the poor get poorer to characterize this process. Or, as so articulately put by Jesus according to the Gospel of Matthew in the New Testament:
For everyone who has will be given more, and he will have an abundance. Whoever does not have, even what he has will be taken from him.
This surprising declaration has been used by some fundamentalist Christians and others as justification for rampant capitalism—a sort of anti–Robin Hood slogan supporting the idea of taking from the poor to give to the rich. But while Jesus’s remarks are a good example of preferential attachment, the quote is, not surprisingly, taken out of context.
It is often conveniently forgotten that Jesus was actually referring to knowledge of the mysteries of the kingdom of heaven and not to material wealth. He was expressing a spiritual version of the very essence of diligent study, knowledge accumulation, and research and education as expressed by the ancient rabbis: He who does not increase his knowledge decreases it.
Geoffrey West is a theoretical physicist whose primary interests have been in fundamental questions in physics and biology. He is a senior fellow at Los Alamos National Laboratory and a distinguished professor at the Sante Fe Institute, where he served as the president from 2005-2009.
From SCALE: The Universal Laws of Growth, Innovation, Sustainability, and the Pace of Life in Organisms, Cities, Economies, and Companies by Geoffrey West, published by Penguin Press, an imprint of Penguin Publishing Group, a division of Penguin Random House LLC. Copyright © 2017 by Geoffrey West.
References
1. The Data Team. The World’s Most Livable Cities. The Economist (2016).
2. IESE Business School. Ranking the World’s “Smartest Cities” Forbes (2016).
3. Bettencourt, L.M.A., Lobo, J., Strumsky, D., & West, G.B. Urban scaling and its deviations: Revealing the structure of wealth, innovation and crime across cities. PLoS ONE 5, e13541 (2010).
4. Youn, H., et al. Scaling and universality in urban economic diversification. Journal of the Royal Society Interface 13, 20150937 (2016).
5. Yule, G.U. A mathematical theory of evolution, based on the conclusions of Dr. J.C. Willis, F.R.S. Philosophical Transactions of the Royal Society B 213, 21-87 (1925).
6. Simon, H.A. On a class of skew distribution functions. Biometrika 42, 425-440 (1955).
7. Barabási, A.-L. & Albert, R. Emergence of scaling in random networks. Science 286, 509-512 (1999).


