Here’s how to cause a ruckus: Ask a bunch of naturalists to simplify the world. We usually think in terms of a web of complicated interactions among animals, plants, microbes, earth, wind, and fire—what Darwin called “the entangled bank.” Reducing the bank’s complexity to broad generalizations can seem dishonest.
So when Tony Ives, a theoretical ecologist at the University of Wisconsin, prodded his colleagues at the 2013 meeting of the Ecological Society of America by calling for a vote on whether they ought to seek out general laws, it probably wasn’t surprising that two-thirds of the room voted no.1
Despite the skepticism, the kinds of general laws made possible by simplification have remarkable predictive powers. They could let us calculate how many species there are in ecosystems that are too big to sample thoroughly, or how many will be lost after habitat destruction.
Perhaps because I started in biology after training in physics, I’m an ecologist who finds beauty in these general laws. In physics, the last thing you’d worry about are differences between one molecule of a gas and another. No one has a personal favorite electron. The ideal gas law relating pressure, volume, and temperature holds equally well for oxygen and nitrogen. Phase transitions between liquids and gases behave in the same way as the magnetization of certain metals.
Why shouldn’t an ecosystem be just as beautifully perfect as an ideal gas, and why can’t ecologists have as much predicting power as a physicist? The answers to these questions just might be “it is,” and “they can.” But only when viewed from a particular perspective.
In the 1980s, two ecologists, Jim Brown at the University of New Mexico and Brian Maurer at Brigham Young University, coined the term macroecology, which gave a name and intellectual home to researchers searching for emergent patterns in nature. Frustrated by the small scale of many ecological studies, macroecologists were looking for patterns and theories that could allow them to describe nature broadly in time and space.
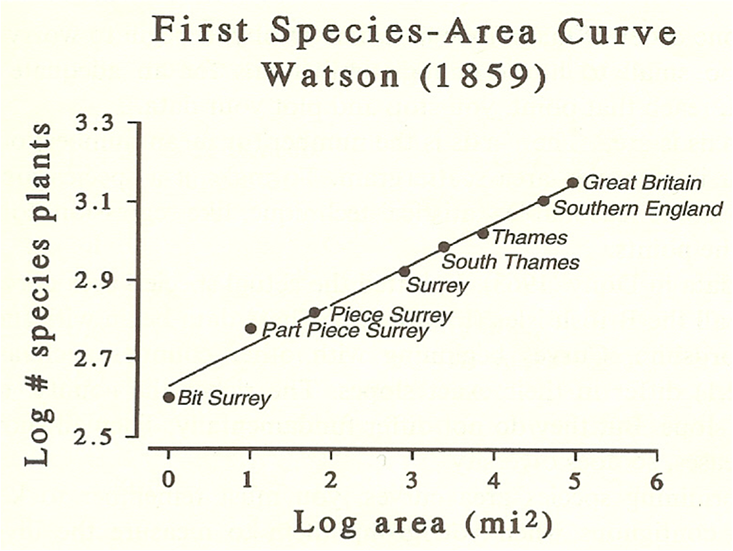
Brown and Maurer had been influenced heavily by regularities in many ecological phenomena. One of these, called the species-area curve, was discovered back in the 19th century, and formalized in 1921. That curve emerged when naturalists counted the number of species (of plants, insects, mammals, and so on) found in plots laid out in backyards, savannahs, and forests. They discovered that the number of species increased with the area of the plot, as expected. But as the plot size kept increasing, the rate of increase in the number of species began to plateau. Even more remarkable, the same basic species-area curve was found regardless of the species or habitat. To put it mathematically, the curve followed a power law, in which the change in species number increased proportionally to the square root of the square root of the area.

Power laws are common in science, and are the defining feature of universality in physics. They describe the strength of magnets as temperature increases, earthquake frequency versus size, and city productivity as a function of population. For many ecologists, the species-area curve strikes a nerve. It suggests that at a large enough scale, the specific detail of an ecosystem—the “entangled bank” that lies so near and dear to the ecologist’s heart—simply doesn’t matter. The idiosyncrasies wash out, and ecological systems start to look surprisingly similar to a broad swathe of disparate systems in other sciences.
The universality of the species-area curve became abundantly clear in the models ecologists built to understand it. In 2001, an ecologist then at Princeton University, Steve Hubbell, developed a model based on the radical assumption that any selective differences (differences which give an evolutionary advantage or disadvantage) between individuals in the same part of a food chain are irrelevant. That means that individual outcomes are a kind of ecological roulette. Some species get lucky, ending up with broad, abundant distributions across space, while other species become relatively rare. Through a combination of analytical equations and computer simulations, his model, called the unified neutral theory of biodiversity, predicted a species-area curve that looked surprisingly realistic. Its success was built on this brutally simplified version of real ecosystems, with plants, animals, and organisms replaced by nearly identical statistical placeholders.
Another ecologist with physics training, John Harte, wondered if the species-area curve could be understood with even less ecological mechanism than the neutral theory supposed. Harte developed the maximum entropy theory of ecology, based around ideas taken from thermodynamics and information theory. Entropy is a measure of the disorder of a system, and is used in thermodynamics to calculate the most likely arrangement of identical gas molecules in a fixed volume. More disorder usually wins. By playing with the spatial distribution of species under certain constraints, Harte used maximum entropy theory to predict the number of tree species across the entire Western Ghats mountain range in India. Their estimate, published in Ecology Letters, fell within a respectable 10 percent of some 900 types of counted trees.2 Harte wasn’t considering the details of individual trees and their reproduction or seed dispersal—his work was purely driven by principles from the realm of information theory.
By ignoring the details of how species compete with and differ from each other, maximum entropy and neutral theory transform the messy, complex tangle of an ecosystem into the idealized perfection of an ideal gas. In doing so, they let ecologists gain a physics-like ability to predict and explain. But both models are also controversial. These details are precisely what ecologists can spend a lifetime investigating, and here are two theories suggesting that they don’t matter.
What if these spatial predictions were correct, but for the wrong reasons? Maybe general ecological models do need to include real ecological detail and mechanisms, and models that ignore these details but still succeed are flukes, restricted just to spatial patterns like the species-area curve. One way to find out was to try to extend these models to another dimension. I chose time.
What would an ecologist do to estimate how many tree species might die in 50 years? What about how many lineages were around millennia ago? A theory similar to the ones modeling the species-area curve would come in handy, just focused on time, instead of space. So I recruited Tom Sharpton and Steve Kembel, colleagues who had previously collaborated with me, to build one.
Bacteria seemed like the obvious subject, partly because they’re incredibly abundant, and partly because DNA sequence data gives us a window into their evolutionary history. Our plan was to count numbers of species, just as was done in species-area curves. But instead of area, we’d use some measure of time.
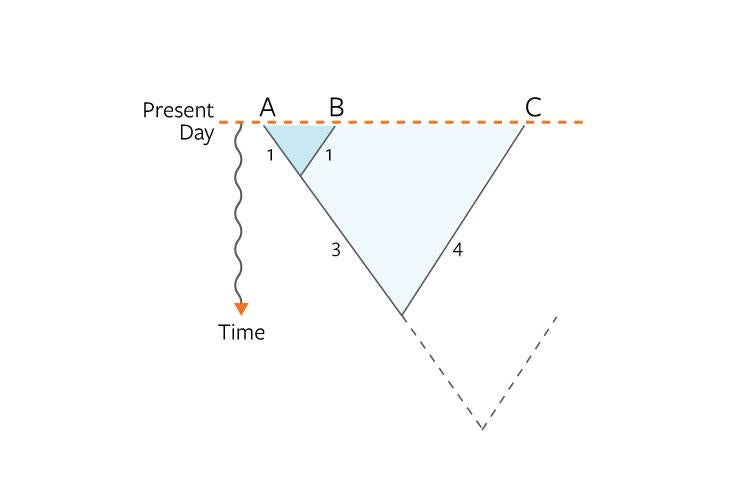
We constructed that measure by comparing DNA sequences among our bacteria, and drawing trees of life. Each branch of a tree represented a new bacterial lineage—some kind of diversification of life deep in the past. The average evolutionary distance (or branch length) between the species on the tree quantified their relatedness through time. The microbes we sampled came from about 25 different habitats, including the nasal cavity of humans, human feces, the surface of plant leaves, the Antarctic Ocean, and water from the English Channel.

When we plotted average evolutionary distance against species number, we found the power law lurking in yet another dimension of ecology: The distance increased rapidly at first, then began to slow in the same manner as the species-area curve.3 The reasons for this behavior are not clear at the moment. One possibility is that both spatial and temporal scaling behaviors are affected by a “burstiness,” in which periods of stasis are punctuated by rapid periods of diversification. In our bacterial trees we found that these bursty expansions have a fractal distribution, also described by a power law, and they could point to radiations of species through both time and space.
The power laws we see for evolutionary distance and diversification point once again to a simple, mechanistic, and relatively detail-free view of ecology at the biggest scales. They’re just not quite as simple as what has been proposed for spatial patterns. They take at least one step back down the spectrum toward needing real ecological and evolutionary mechanisms to explain macroecological patterns.
Another ecologist once asked me, what do we ever learn from scaling? It’s a fair question. There are many ecologists who’ve never used a species-area curve. For me, there’s the intellectual thrill and challenge, and the element of surprise when one finds unexpected similarities across different systems. There’s also the power of the predictions that scaling make possible. If we can develop a theory that really helps us understand macroecology, we may make better estimates of how today’s loss of Amazonian diversity will alter the tropics in 100 years. Or how the interactions of bacteria in the human gut might alter its future.
There’s something more, too. In ecology there will always be a huge heterogeneity, from insects to birds, grass to redwoods. We can and do care about differences between different organisms and species, and not just about aggregated patterns. So as we learn about universal and simple scaling patterns in ecology, we are faced with a brand new challenge: How do we integrate the generalities we learn from scaling in aggregated patterns with natural history and the fine details among different organisms and systems?
There’s a useful complement to Ives’ question at the Ecological Society meeting. It’s not just whether ecology should pursue general laws, but how those of us who chase those laws, and those who of us who focus on the tangles that create them, can work together. There’ll be a lot to learn when we figure that connection out.
James O’Dwyer is a theoretical ecologist in the Department of Plant Biology at the University of Illinois at Urbana-Champaign.
References
1. Fox, J. ESA Monday review: Tony Ives rocks. Dynamic Ecology dynamicecology.wordpress.com (2013).
2. Harte, J., Smith, A.B., & Storch, D. Biodiversity scales from plots to biomes with a universal species-area curve. Ecology Letters 12, 789-797 (2009).
3. O’Dwyer, J.P., Kembel, S.W., & Sharpton, T.J. Backbones of evolutionary history test biodiversity theory for microbes. Proceedings of the National Academy of Sciences 112, 8356-8361 (2015).
Lead Image courtesy of Edhv, www.edhv.nl (Eindhoven, the Netherlands).


