In a recent interview for the web series Hot Ones, where guests answer tough questions while eating super-spicy chicken wings, pro basketball superstar Stephen Curry was asked about a sports psychology study from the 1980s. The subject of the study was the "hot hand effect," the idea that players’ successes come in streaks—dependent on some mysterious inner quality that ebbs and flows—and when a player’s hand is hottest and they’re “in the zone,” it can feel almost like they can’t miss.
Curry knows a thing or two about a hot hand. He holds the NBA record for making at least one three-pointer in 268 consecutive games. Following a practice one day, he sank 105 three-pointers in a row. In the Hot Ones interview, Curry said the authors of the study “don’t know what they’re talking about at all." When Curry totaled 60 points in one game, he said, "It's literally a tangible, physical sensation of all I need is to get this ball off my fingertips and it's going to go in."
The study, “The Hot Hand in Basketball: On the Misperception of Random Sequences,” was written in 1985 by eminent psychologists Thomas Gilovich, Robert Vallone, and Amos Tversky. They allegedly demonstrated through an analysis of basketball shooting data that the hot hand was a myth. Recently deceased Nobel laureate (and Tversky’s chief collaborator) Daniel Kahneman proclaimed, “The hot hand is a massive and widespread cognitive illusion.” In statistical circles, the hot hand study has taken on a metaphorical significance beyond basketball. For decades, the fallacy of the hot hand has been cited to show that folktales of luck and streakiness are no match for cold, hard numbers.
However, the numbers do not prove the hot hand is a figment of imagination. Economists Joshua Miller of the University of Melbourne and Adam Sanjurjo at the University of Alicante in Spain, used data from multiple basketball leagues, including the same data used by Gilovich, Vallone, and Tversky, to provide robust support for a hot hand. The problem, say Miller and Sanjurjo, lies in the way the original authors analyzed their data and, in particular, a mistake they made about what random data should look like without the influence of a hot hand.
The mistake is this: Imagine we’re looking at a chart of hits and misses over some number of shots and trying to find where a shooter might have had a hot hand. Suppose we look for hot-handedness by considering only those attempts that came after a sequence of hits, such as three baskets in a row. These sequences are candidates for being shot with a “hot hand.”
Shouldn't years of testimony from athletes like Stephen Curry count for something?
However, if there’s no such thing as a hot hand, we might expect the player to have the same success rate in these attempts—the shots after three consecutive makes—as their overall average. Since our working theory is that the previous successes have no predictive power for the next shot, it would seem intuitive that our choice of shots based on what happened right before the hot streak shouldn’t matter at all.
But that’s wrong. By selecting attempts that come after a hot streak and computing a proportion over this subset, we have unwittingly introduced a negative bias into the estimate of the rate of success that could counteract a hot-hand-induced positive effect. In other words, the observed percentage of success-following-success being equal to the rate of success-following-anything, would be evidence for the hot hand instead of against it. The way we selected the data artificially penalized the shooter; their true success rate may have been a few percentage points higher than what we tabulated. So, if our observation matched their usual average, it must be that something else was at work to offset our bias—a hot hand.
If you find yourself doubting this bias exists, you’re in good company, including the esteemed professors who first “debunked” the hot hand. Like other famously counterintuitive examples in probability, such as the Monty Hall Problem—the puzzle of whether to switch doors when searching for a prize on the game show Let’s Make a Deal—the phenomenon acts almost like an optical illusion: Our natural senses tell us something that turns out to be contradicted when we try to confirm it with hard measurement.
I’ll freely admit that I didn’t believe it either, at first. I only became convinced after I ran 100,000 simulations of 100 random coin flips and tabulated the proportions of heads following streaks of three heads. I knew the coin flips were perfectly random 50/50 processes under any conditions (coins don’t get “hot”). So, if I estimated the success rate at anything less than 50 percent, the bias was real. The overall average proportion of heads-after-three-heads I got was around 46 percent. The histogram (data visualization) of results clearly showed the negative bias. Without understanding the source of the bias, we might think the coin had the opposite of a hot hand. This was mechanically the same procedure as the original 1985 study, showing the study was flawed and its conclusions likely invalidated.

To see how this could possibly work, consider a simplified example of three coin flips. Suppose we want to determine if a coin coming up heads is more likely to be followed by another heads—to see if the coin can get “hot.” There are eight equally likely sequences of flips:
HHH
HHT
HTH
HTT
THH
THT
TTH
TTT
Out of these, the proportions of heads being followed by heads are as follows:
1
½
0
0
1
0
N/A
N/A
(We discard the last two cases because no coin flip came after a head.) Averaging the estimated proportions over the remaining six cases yields (1+½+1)/6 = 5/12, or about 42 percent. That is decidedly less than 50/50.
Even though we know the coin has no memory or “momentum,” estimating this way produces a number less than the true success probability in these situations, on average. As Miller and Sanjurjo demonstrated, this bias gets larger when you consider smaller samples and longer streaks. In the typical experiments like those in Gilovich, Vallone, and Tversky’s work, looking at streaks of two or three in samples of around 100, it could make a sizable difference.
Now, we might expect some strange things to crop up when we process the data the way I have described above. For one thing, we’re talking about an average proportion: the average over all the possible universes of the proportion of attempted shots that were successful after a streak of hits. Further, “average proportions” are notoriously finicky, especially when the proportions are being computed over different numbers of events, as they are here.
The numbers do not prove the hot hand is a figment of imagination.
In some sequences of coin flips in the table above, we had two cases to consider (such as the first and second ones) while in others there was only one. Compiling proportions taken over different sized sets is how we get famous examples of weird behavior like "Simpson’s Paradox," in which a variable may trend one way among subsets of a larger group while the overall trend is the opposite.
For another thing, in our dataset of hits and misses, some of the streaks we might be considering necessarily overlap with each other. For example, if somewhere in the midst of 100 coin flips we had the sequence HHHHT, this would account for two streaks of three heads, one that’s followed by another heads and a second followed by tails. This means, in fact, that unless the segment we’re currently considering lasts until the very end of the data, there must at some point be a streak that ends in failure. The necessity of these failures contributes to the negative bias in our estimate of the rate of success.
Of course, real-world data is not like an idealized sequence of coin flips, and in a team sport like basketball, the picture is made messier thanks to confounding variables. This is due to an overall lack of available data from real games, and the fact that, often, when a player gets hot, defenses will change their strategy to compensate.
What’s more, a player on a shooting streak, who may have a hot hand or not (some streaks are just luck), may take greater risks, such as attempting more difficult shots, known colloquially as “heat checks.” If these attempts result in misses, then a look at just the data would suggest the player was never hot. Some players may get nervous after a few successes because they feel all eyes are on them, whereas for others the pressure of a big game or a cheering crowd may be integral to the emergence of a hot hand. Controlled experiments where the strategic factors are held fixed but the psychological environment is preserved are hard to come by.
That’s why Miller and Sanjurjo claim perhaps the strongest evidence for the hot hand effect is in the three-point shooting contest, held during the NBA’s All-Star weekend festivities; there’s no defense and the shot locations are fixed. Players have 70 seconds to shoot up to 27 balls. Performances like Craig Hodges hitting 19 shots in a row in 1991 seem like clear examples of a hot hand at work. (Curry has won the contest twice.) From there, Miller said, it’s reasonable to extrapolate to in-game settings, and “then you can couple that with what the players themselves say.” Or do. “This guy shot the basketball and started walking the other way,” commentator Mark Jackson once remarked during a game after Dwyane Wade, the former Miami Heat star, launched a three-pointer with such confidence that he didn’t bother to watch it go in. “That’s called being in the zone.”
The saga of the hot hand effect offers at least one final cautionary tale.
However, there’s the crux of the issue: Should we trust people’s subjective experiences of what it’s like to be “in the zone,” or should we assume there’s no such thing until it shows up in the data? Cognitive biases, such as finding patterns where none exist, are certainly real, and people’s ability to discern the presence of randomness is notoriously bad. Go to any casino and watch at the roulette table as people try to spot streaks in the most recent spins or look online for advice about tradeable “signals” in the movements of stock prices. But shouldn't years of testimony from high-performing athletes like Curry count for something?
The claim that the hot hand is an illusion is equivalent to saying players’ skill levels are perfectly constant through time. Compared to the hot hand effect, this is arguably the bolder statement in need of evidentiary support. Many human activities—from sports to literature to theoretical physics—involve some combination of skill and luck to create success. But it’s misleading to think of the “luck” component of that mix as truly “random.”
Instead, it’s perhaps better described as uncontrollable by the person involved in performing the action—the tiny fluctuations in the conditions of the ball, fingers, arms, feet—the unaccounted-for variations and moments of inspiration that are beyond the skill level of that particular player to reliably dictate at that particular moment.
But who’s to say the boundary between controllable and uncontrollable can’t shift? The relative shares of “luck” vs. “skill” could be dependent on many situational factors. Players might reliably be able to sense when finer details that are normally beyond their control are suddenly within their grasp. That’s “the zone.”
The saga of the hot hand effect offers at least one final cautionary tale about the enduring power of random phenomena to fool us all (myself included), even—maybe especially—when we think we’re unfoolable. The counterintuitive properties of streaks in random sequences tricked the original researchers into overlooking a pattern that was really there in the data. The percentage of successes under their method of selecting candidate shots included a bias that erased the effect of the hot hand to boost the success rate.
But by simulating synthetic data under known assumptions and verifying that their methods retrieved the right answers, they might have protected themselves against the illusions of probability. Tversky, after publishing his research and becoming one of the most outspoken critics of the hot hand, once said as much: “It may be that the only way you can learn about randomness is to toss coins on the side while you play.” During the NBA Finals this week between the Celtics and Mavericks, if you happen to notice any players on the bench compiling histograms of coin tosses, they might just be trying to understand whether it’s statistically valid to conclude their teammates are heating up. 
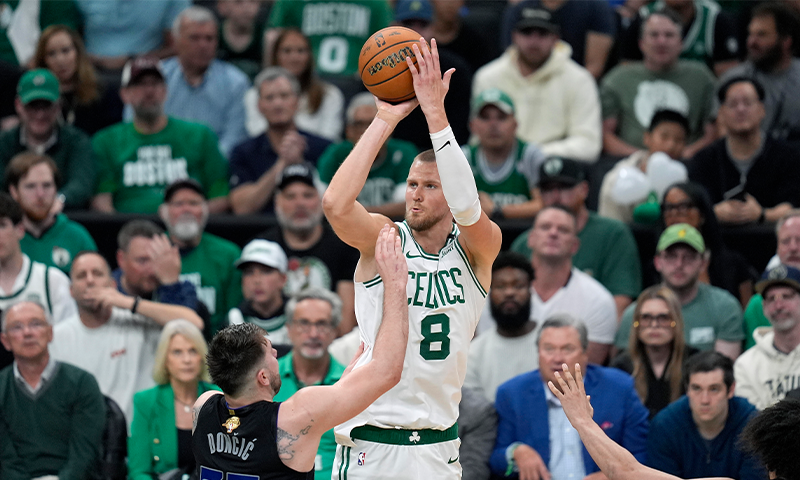
Lead photo: Boston Celtics center Kristaps Porzingis shoots over Dallas Mavericks guard Luka Doncic during Game 1 of the 2024 NBA Finals. (AP Photo/Charles Krupa)