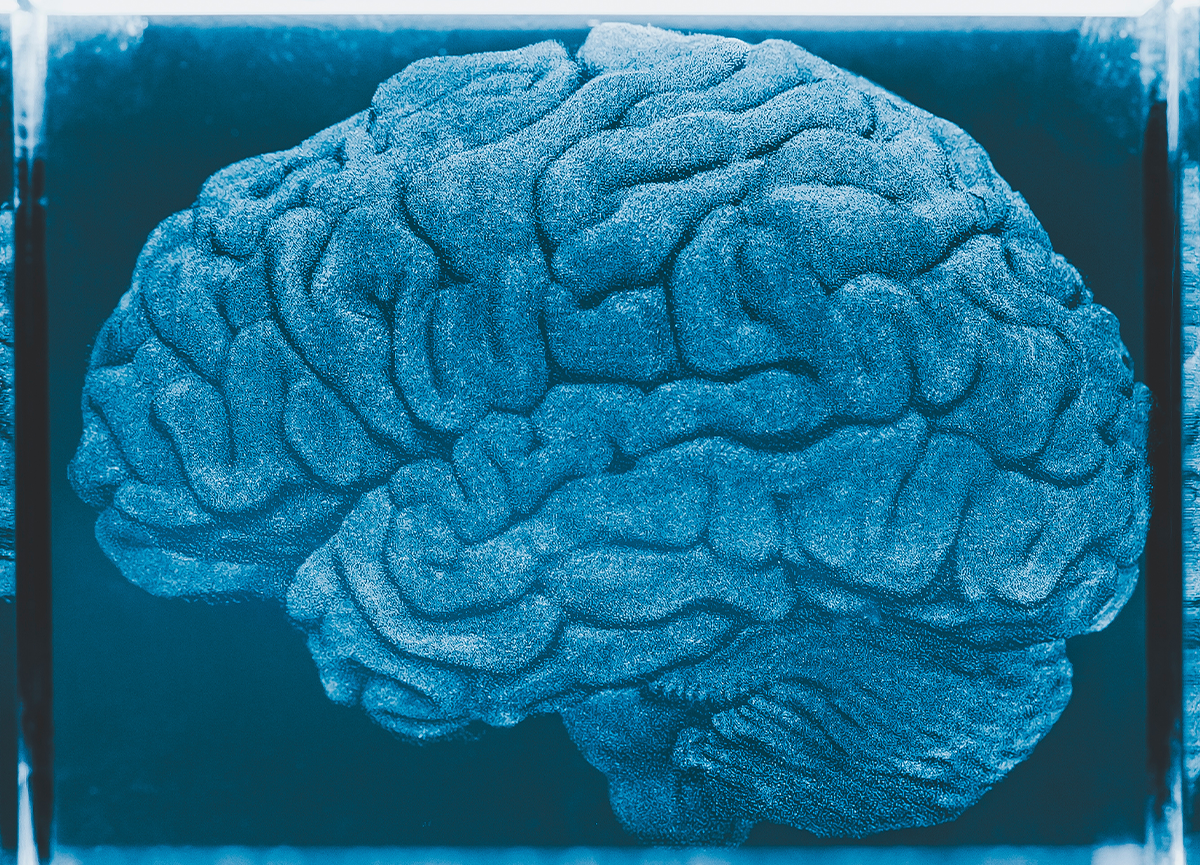
One autumn afternoon in the bowels of UC Berkeley’s Li Ka Shing Center, I was looking at my brain. I had just spent 10 minutes inside the 3 Tesla MRI scanner, the technical name for a very expensive, very high maintenance, very magnetic brain camera. Lying on my back inside the narrow tube, I had swallowed my claustrophobia and let myself be enveloped in darkness and a cacophony of foghorn-like bleats.
At the time I was a research intern at UC Berkeley’s Neuroeconomics Lab. That was the first time I saw my own brain from an MRI scan. It was a grayscale, 3-D reconstruction floating on the black background of a computer screen. As an undergraduate who studied neuroscience, I was enraptured. There is nothing quite like a young scientist’s first encounter with an imaging technology that renders the hitherto invisible visible—magnetic resonance imaging took my breath away. I felt that I was looking not just inside my body, but into the biological recesses of my mind.

It was a strange self-image, if indeed it was one. My hair did not show up, leaving just the skull and outline of the face with a cross section of the tissues inside. Dragging my mouse, I cruised through the horizontal slices of my brain—there were the branching, root-like patterns of the cerebellum, the gaping black holes of the ventricles, and the undulating ridges of my cortex looking like snakes wiggling in the sand.
Full of excitement after my encounter with MRI, I consumed scientific papers and studied their figures, which were usually grayscale brains with bright orange and blue blobs on them indicating regions of increased activation. The following year I joined a lab at Harvard, where I started working on an experiment that used functional MRI, or fMRI, to study the brain regions involved in social decision-making. fMRI allows us to record what the brain is up to while people perform mental tasks. I committed to a senior thesis and set my future sights on a Ph.D. in cognitive science.
We seek something deeper in these pictures of blood flow in the brain.
Little did I anticipate what a scientific morass I had entered. Functional magnetic resonance imaging has transformed medicine. It allows non-invasive mapping of a patient’s brain regions to enable more accurate, precise neurosurgery,1 as well as validating pharmacological effects of potential drugs on human brains.2 But fMRI’s use in cognitive and psychological science is notoriously controversial. This is partly because the technology doesn’t directly measure neural activity but rather a proxy for it—oxygenated blood flow. It also requires a tremendous amount of data processing to sort signal from noise, data processing that requires many discretionary choices on the researcher’s part.
In recent years, the field has dealt with a host of issues involving software glitches,3 misapplied statistics,4 and irreproducible studies.5 These challenges have complicated MRI use in clinical and commercial contexts. Companies have attempted to bring fMRI into the courtroom to share what the brain reveals about truth-telling, insanity, and injury. It seems we seek something deeper, more human in these pictures of blood flow in the brain. We are looking for the mind and all its intricacies, the seat of agency, personality, and madness.
This is a story about how we—scientists and non-scientists, journalists and readers—tell illustrated stories about the brain in our attempt to understand the mind. When we talk about some part of the brain “lighting up,” or a blob on the cortex serving as the hub for social pain, our language is shaped by the form of the brain images we see, and that image form emerges perhaps more from human choices than biological facts. This is also my story. I was determined to pursue a career researching the neural mechanisms of intergroup relations. If we could untangle the brain’s role in our social biases, we might one day overcome them. MRI was going to light the way.
Stick out your arms and legs like a starfish, and I’ll make sure you aren’t secretly a metal robot,” my scanning buddy and postdoctoral mentor, Will, said to the volunteer participant. Will guided a metal detector wand over the participant’s body. (fMRI studies demand an obsessive meticulousness about checking for metal, and justifiably so—the 3 Tesla magnetic field of the scanner at Harvard’s Center for Brain Science Neuroimaging is strong enough to suck an office chair into the machine. Anything magnetic will quickly become a deadly projectile.)
After the participant laid supine on the scanner bed, Will and I snapped on the head coil, a clunky helmet which emits and receives radio frequency pulses from the machine. It reminded me of an especially unwieldy superhero mask. Our volunteer would be doing a decision-making task, in which he would repeatedly choose to play slot machines that yielded two different kinds of monetary rewards: one that gave money to people who shared his political party, and one that did that and subtracted money from people of the opposite political party. We were interested in whether he demonstrated a preference for one reward over another. (We would later calculate some participants were inclined toward the reward that hurt the other political party—they had a taste for out-group spite—and this preference may have a neural correlate.)
After strapping a button box onto his right hand, I raised the scanner bed and watched him glide slowly into the small cave of the magnet. Once back in the control room, Will launched the experiment’s slot machine game. Soon we heard the frenetic stream of high-pitched beeps that indicated we had begun to collect functional images of his brain. At times it seemed bizarre, studying the neurobiology of intergroup decisions by sticking a single person into a chilly, spaceship-esque donut to play what were essentially low-graphic video games for an hour. These are, however, the constraints of most fMRI lab studies—a highly simplified computer task interface that mimics features of the real world while the machine tracks your blood flow patterns.
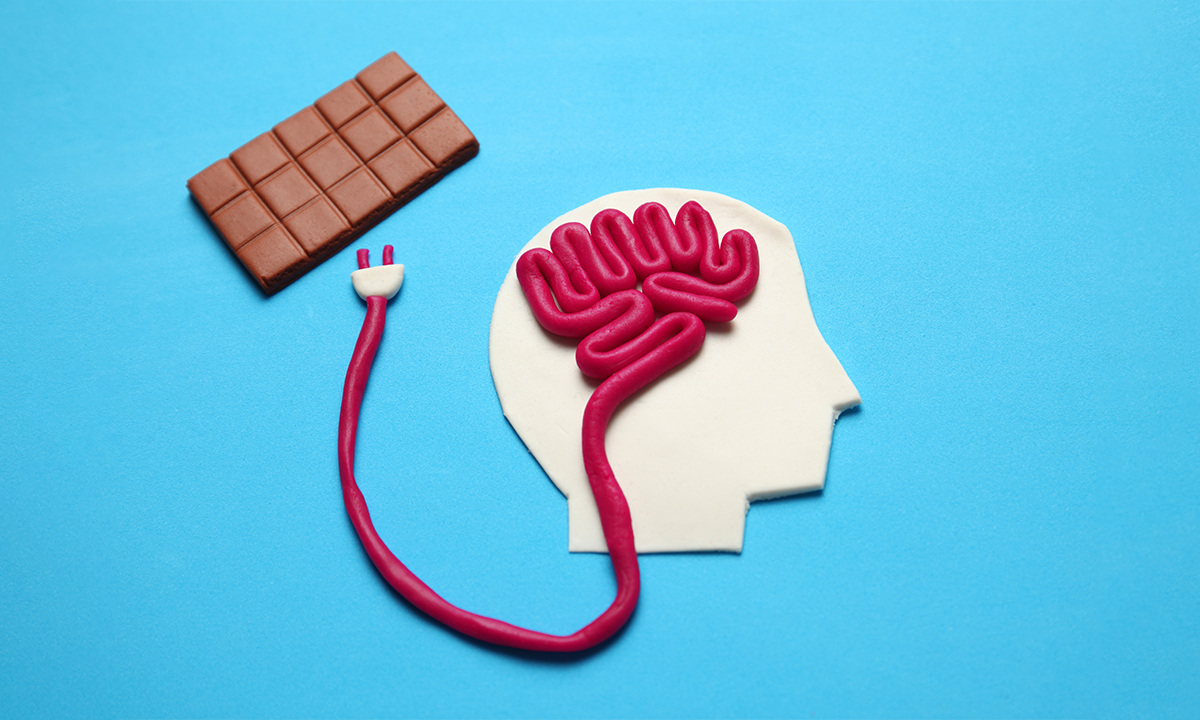
MRI measures the BOLD—blood oxygen level-dependent—signal. Since neurons need oxygen when they’re firing, more oxygenated blood will travel to that local region of the brain. Rick Born, a neurobiologist at Harvard Medical School, who studies the visual cortex using electrophysiology, helped me understand the process. In the break room of his lab, he was chatty and exuded that particular form of excitement that scientists have when talking about their field. He drew animatedly on a white board, sketching a diagram with arrows going from the words “neural spikes” to “extracellular field potential” to “increased metabolism” to “increased blood flow.” Because, for the most part, scientists can’t measure neural spikes directly in humans (that requires opening up the skull and directly implanting electrodes, which is done in animals but only done in humans for medical cases like epilepsy treatment), we have to content ourselves with fMRI’s indirect proxy.
It’s like surveying 100,000 strangers about whether they know Beyoncé personally.
So how does the machine detect oxygenated blood flow? The answer lies in the atomic world and its quantum properties, specifically nuclear magnetic resonance—that’s where the “M” and “R” in fMRI come from. In the presence of a very powerful magnetic field, hydrogen protons align with each other; you can picture them all pointing in the same direction. A well-coordinated radiofrequency pulse from the MRI machine will knock them off their alignment, like a finger flicking over a bobble toy. Bobble toys bounce back, and so do hydrogen protons. They will gradually “relax” back to their initial alignment. Hydrogen protons present in the skull will relax at a different rate than protons in the cortical tissue, giving us a way to use mathematical processing to generate pictures of anatomy.
But fMRI gives us more than anatomy. The “f” indicates a vital distinction. The MRI scan many people receive at the hospital is usually an anatomical MRI scan, providing high-resolution 3-D images of muscle, tendon, and bone tissue, able to highlight potential injuries like tendon tears or diseases like cancer. On the other hand, fMRI captures the liveliness of our brains and bodies, measuring the active movement of blood over time that is related to neural firing and cognition.
It’s able to achieve this because of the complicated dance of magnetic resonance. Each hydrogen proton has a quantum property called “precession frequency”—a rotating spin. A radiofrequency pulse not only knocks protons down, but synchronizes their spins with each other, matching their precession frequencies into a coordinated group choreography. After the pulse, the precession frequencies gradually become unsynchronized again as the protons return to their upright orientation, spinning off at different rates like dancers embarking on their solos. This fact of nature, which makes fMRI possible, is that this process of desynchronization happens more slowly in the magnetic field of oxygenated blood in a brain. That is, protons in oxygenated blood more effectively stay in sync, emitting a stronger signal than protons in deoxygenated blood, a difference that the MRI scanner detects as the BOLD signal.
Finally, the “I” of fMRI stands for “imaging” because the output of this process is essentially a 3-D video of the brain in action. The scanning process divides the brain into small cubes called voxels, the three-dimensional equivalent of pixels. The data collected from a person’s scanning session consists of quantitative measures of the BOLD signal at every voxel. Voxels typically range in size from 1 cubic millimeter to 27 cubic millimeters—small to us, but colossal on the scale of neurons. For a sense of scale, the brain contains an estimated 100 billion neurons, and a single voxel in the human cortex can cover over 500,000 neurons. Those neurons may be doing any number of things—exciting each other, inhibiting each other, or firing in different patterns within sub-populations—but all that fMRI can detect is the net change in oxygenated blood over that whole voxel space every 2 seconds. This is like trying to determine the average opinion on foreign policy from 500,000 different people arguing, agreeing, and debating simultaneously.
After Will and I had scanned close to 50 people, it was time to start wrangling those terabytes of data. I grabbed a cup of coffee, plugged in my headphones, and started playing music by the band Hippo Campus (thematically appropriate, I suppose), settling in for a long night in the library. I was doing quality control checks, in which I looked for unnatural stripes or unusual brightness in the brain data we had collected.
Using a special software program, I viewed the raw functional data—a gray and black video of a fuzzy brain slowly pulsing. In essence, the raw data that emerges from the scanner is a four-dimensional matrix that records changes in every voxel over time. The living, biological flesh of the brain that lay inside the scanner has been transformed into a set of numerical time series. It is the same thing that happens when you take a photo of the sunset—the camera converts the physical scene into a matrix of numbers, pixel intensities, and color. You can do a lot with a brain once it is in this numerical form. Using the computational neuroscientist’s lab bench—a computer and desktop—I could warp, smooth, and filter these brains, a stage of analysis known as data pre-processing.
fMRI is a game of millimeters. Minute movements of the head greater than 3 millimeters can produce distorted, ultimately unusable images. Pre-processing helps correct for motion by applying mathematical transformations that shift the brain back in place every time it bounces or rolls. Pre-processing also takes the fuzzy, raw functional brain data and via stretching, shifting, and shrinking voxels, transforms it to match first, the participant’s anatomical scan, and second, a standard brain template.
Human brains exhibit considerable variability—slightly lopsided hemispheres, a lumpy occipital lobe, or just overall larger size (as practitioners of craniometry noticed early on). Without matching each participant’s brain to a template, we would never be able to compare brain activity across an entire study sample.
Algorithms spatially smooth the data, which means averaging the activity of neighboring voxels in another attempt to eliminate noise. At least, what we think is probably noise; one always hopes they aren’t filtering out the real signal of interest. It’s like rubbing your finger over a pencil drawing to even out the shading. All this reshaping and correction produces brain images that are sharper, more uniform, and less rough around the edges—at the price of spatial resolution.
There are countless variations of pre-processing steps, and despite standardization initiatives spearheaded at Stanford’s Center for Reproducible Neuroscience, there are still very few standards that the whole field follows, leaving many choices up to the individual researcher’s discretion. Seemingly inconsequential decisions about which computer operating system, software program, or scanner hardware to use can produce pivotal differences in results.
“Magnetic resonance’s strength is that it is a massively flexible technology,” said Bruce Fischl, the director of the Computational Core at the Martinos Center and Massachusetts General Hospital, and one of the early pioneers of fMRI analysis algorithms. “It can generate images of structure, images of function, even map something related to neural connectivity, or look at chemical change. The downside of that flexibility is that it’s difficult to standardize any set of images across different labs.”
Well, better luck on future analyses.” Will and I stared at the grayscale brain template, an aggregate of statistics from all our subjects, which was completely devoid of color—no hot spots, no clusters to use as future regions of interest. We had come to the stage after preprocessing, the actual statistical analysis. We had hypothesized that we would see differential activity in the subcortical reward circuitry depending on whether the monetary prize inflicted harm on the out-group, which could suggest a reward signal influencing decisions to harm a competing group. After all those nights spent scanning, weekends in the library learning a new programming language, and hours trouble shooting the experimental setup, I had hoped we would see a novel outcome—but this was a null result, a dud. Fortunately, it was just our preliminary analysis, but I still felt disheartened.
A common misconception is that fMRI studies tell us which brain regions are active during certain tasks. In fact, everything is relative. fMRI studies can tell us which brain regions are more active in one task than in another task. Put another way, fMRI analysis tells us which collections of voxels have activity profiles more closely matching one condition than another. Even cutting edge methods that capitalize on developments in machine learning analyze whether voxels collectively contain information that can discriminate one condition from another.
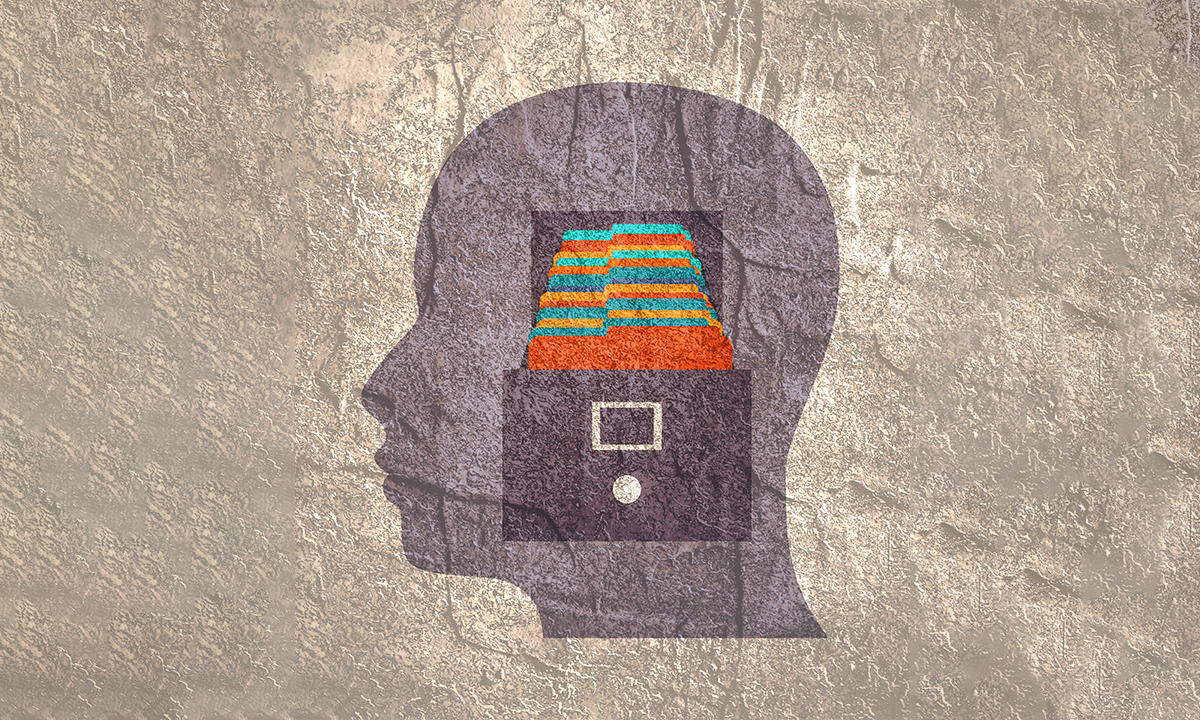
The most common analysis procedure in fMRI experiments, null hypothesis tests, require that the researcher designate a statistical threshold. Picking statistical thresholds determines what counts as a significant voxel—which voxels end up colored cherry red or lemon yellow. Statistical thresholds make the difference between a meaningful result published in prestigious journals like Nature or Science, and a null result shoved into the proverbial file drawer.
Scientists are under tremendous pressure to publish positive results, especially given the hypercompetitive academic job market that fixates on publication record as a measure of scientific achievement (though the reproducibility crisis has brought attention to the detriments of this incentive structure). If an fMRI study ends up with a null or lackluster result, you can’t always go back and run another version of the study. MRI experiments are very expensive and time-intensive—my own required upward of $25,000 and took over a year to finish. You can see how a researcher might be tempted, even subconsciously, to play around with the analysis parameters just one more time to see if they can find a significant effect in the data it cost so much to obtain.
“fMRI is clearly not pure noise, it’s a real signal, but it’s subject to many degrees of freedom, fiddling around with the data, filtering it in different ways until you can see whatever you want to see,” Born said.
You can see how a researcher might be tempted to play around with the parameters.
The problem of statistical excess, called multiple comparisons, looms large over this part of the analysis. “That’s probably the single biggest issue in brain imaging,” Fischl told me. Multiple comparisons means too many statistical tests. The problem of multiple comparisons is like surveying 100,000 strangers about whether they know Beyoncé personally. None of those 100,000 people are actually acquainted with her, but for each person you ask, there is a 5 percent chance they will lie and say they are, just for kicks. In the end, you tally 5,000 friends of Beyoncé, even though the ground truth is that zero of those people are friends with her. If you had asked 100 strangers, you would only end up with five incorrect measurements, but because of sheer numbers and the probability of random deception, surveying 100,000 strangers results in 5,000 incorrect measurements.
So, too, with fMRI data: One person’s brain data has hundreds of thousands of voxels. By the sheer number of voxels and random noise, a researcher who performs a statistical test at every voxel will almost certainly find significant effects where there isn’t really one.
This became clear in 2009 when an fMRI scan detected something fishy in a dead salmon. Craig Bennett, then a postdoctoral researcher at the University of California, Santa Barbara, wanted to test how far he could push the envelope with analysis. He slid a single Atlantic salmon into an MRI scanner, showed it pictures of emotional scenarios, and then followed typical pre-processing and statistical analysis procedures. Lo and behold, the dead fish’s brain exhibited increased activity for emotional images—implying a sensitive, if not alive, salmon. Even in a dead salmon’s brain, the MRI scanner detected enough noise that some voxels exhibited statistically significant correlations.6 By failing to correct for multiple comparisons, Bennett and his colleagues “discovered” illusory brain activity.
The problem lies in what we ask of these results and the authority we give them.
To correct for multiple comparisons, neuroimagers must establish stringent thresholds for statistical significance. “It’s hard because we don’t know what the right directions are,” Fischl told me. “As a researcher, you’re left with a choice: Are you going to live with missing stuff? Or are you going to live with showing stuff that’s not real?”
Fischl is talking about how statistical thresholds have to strike a balance between a scientist’s two deepest fears: false positives (mis-identifying noise as signal) and false negatives (losing the signal amidst the noise). Therein lies the rub: The field has not yet settled on a best practice solution to multiple comparisons because people cannot agree on the right balance of strictness. Moreover, all the possible corrective procedures have important weaknesses, like assuming the voxels are independent of each other even though they are not.
In 2016, another paper rocked the neuroimaging world. Anders Eklund, Thomas E. Nichols, and Hans Knutsson published an empirical investigation of glitches in common fMRI software analysis packages.3 These software bugs greatly increased the chance of false positive results, in some cases to over 70 percent instead of the 5 percent error rate most researchers assume. This revelation called into question previous published studies—findings about brain correlates of personality, neural representations of knowledge, even the neural signatures of decision-making.
The first time I read the Bennett and Eklund papers, I sat in a chilled stupor. Was the research I was doing and reading even real? Bruce Rosen, the director of the Martinos Center for Biomedical Imaging in Massachusetts, offered me a more tempered take. “The salmon paper showed that you could do analysis in a way that seems reasonable and get this really dumb result,” Rosen said. “Am I surprised that you get a dumb result? Hardly. fMRI detects a remarkably big signal, but it’s still a signal of 1 percent change from baseline. Is it easy to screw things up so that you see changes of 1 percent? Pretty easy.”
As for the Eklund, et al. paper, Rosen conceded, “It was an excellent point of statistics. It’s actually a point we understood, but there are no doubt lots of people that didn’t understand.” But he thinks the paper’s implications were overblown. “The impact of that paper was actually pretty modest in terms of the number of results that were invalidated, that were important results. And whether we were significantly misleading people or sending doctors astray or anything like that, was negligible as best as I could tell. But the paper got a lot of press, and suddenly, now fMRI has a black eye.”
That black eye has not deterred optimistic speculations about the technology. In a 2019 Wall Street Journal article, tech entrepreneur Jerry Kaplan wrote about “The Machines That Will Read Your Mind.” Kaplan’s article highlights the convergence of machine learning advances and fMRI data, exploring the possibility of using neuroimaging for detecting lies, judging guilt in legal settings, determining when someone is truly “in pain” from a disease, and brain activity surveillance. It sounds like the premise to a Black Mirror episode: “Someday it may be possible to learn to some level of precision whether your spouse really loves you, finds you attractive or is having an affair.”
The interest in deception and the brain is not new. Since 2008, companies like No Lie MRI and Cephos have raced to develop adequate research to use fMRI in lie detection, offering their services to legal defendants looking to validate their alibis. Most scientists and legal scholars agree that the technology is not ready for legal applications, and several courts have denied requests to use fMRI evidence in arguments.7 But as recently as 2016, Robert Huizenga, investor in No Lie MRI, was still promoting the company on The Dr. Oz Show. He touted fMRI as the “first unbiased, scientifically-backed way to differentiate a lie from truth telling.”
The phrase “the brain lights up” is an artifact of the images that we craft.
Rosen said he understood how fMRI images take on a special persuasiveness. “The clarity of the images lead to the implication of something more than what the image is,” he said. “You see a spot on the brain and you feel like, ‘Oh, this is so clear.’ And then when you look at the underlying data you realize, eh, it’s a pretty small signal that the statistics probably suggest. It’s more a probabilistic than real result. Whereas when you see the bright spot, it doesn’t seem probable at all, because there it is, right? Inarguable.”
It is precisely this power of brain images’ projected scientific authority that led anthropologist of science Joseph Dumit to comment on the “undue risk in courtrooms that brain images will not be seen as prejudiced, stylized representations of correlation, but rather as straightforward, objective photographs.”8
In attempts to mitigate sentences, lawyers have adduced brain images as evidence of pathologies in criminal defendants. Arguments often take the following form: The defendant has a neurological or psychiatric disorder that impairs cognitive and moral reasoning. This image reveals the brain abnormalities associated with the psychopathology.
In court cases involving capital punishment, neuroimaging evidence can literally become a matter of life and death. At the same time, this kind of evidence validates conceptions of distinct human kinds: the mad and the sane, the pathological and the healthy, with these categories borne out in shining pictures of brain activity. In doing so, it privileges biological conceptions of personhood over other more holistic notions of a human life.
One concerning upshot of this is the medicalization of deviance, which can ultimately motivate biological intervention to eliminate behaviors considered non-normative or wrong. That is, fMRI often purports to show that a brain is “broken,” and a broken brain demands to be fixed. This can lead to ethically fraught initiatives like recent efforts to electrically stimulate prisoners’ brains in order to reduce aggression.9 Here, the issue of interpersonal violence, a social issue influenced by many structural and cultural factors, comes to be located in the brain at the level of the individual. This is in no small part because of the tight hold that brain images have on our imagination of the mechanisms structuring human behavior, especially stigmatized dispositions like mental illness and criminality.
I leaned back in my chair, squinting through the late afternoon sun from my lab’s office on the 14th floor of William James Hall. The amount of useless, random chatter in fMRI data was beginning to overwhelm me. How can we extract the true signal amid such numerical clamor, especially when our statistical programs and know-how are flawed? Which results should I believe? Most importantly, how can we use fMRI technology responsibly, without reifying narrow biomedical definitions of pain, desire, and other human emotions?
“Scientists are human beings, and if there’s one thing we know about human beings, it’s that we’re pretty good at fooling ourselves when we want to believe something,” Born said to me. I don’t want to fool myself, or for us to collectively fool ourselves, about what fMRI can unveil about the brain.
In March, 2020, the same week in which the World Health Organization declared COVID-19 a global pandemic, I submitted my senior thesis, which allowed me to graduate with a joint degree in neurobiology and philosophy. It contained the write-up of my fMRI experiment, including the null result and future directions for other analysis. I also argued some forms of fMRI evidence could illuminate the immorality of schadenfreude, the emotion where you feel pleasure in another person’s or another group’s misfortune. I’m proud of my thesis and sincerely enjoyed collecting and analyzing neural data.
But in the process of doing this research, I was forced to confront this fact: fMRI is an imprecise camera that captures blurry images of blood, not neurons, and requires extensive computational manipulation before we can even view the images. If we want to avoid surgery or drugs, it is the best brain camera we have, and a pretty poor one at that. fMRI has produced important results and knowledge. It has allowed us to envision the systematic organization of the cortex across adult humans, which “provides a new lever for investigating the human mind’s developmental and evolutionary origins,” as Nancy Kanwisher, professor at MIT’s McGovern Institute, put it. It has also allowed neuroscientists to learn about the brain’s default mode network, which plays a key role in autobiographical memory and planning.
The problem lies in what we ask and expect of these scientific results, and the authority we give them. After all, the phrase “the brain lights up” is an artifact of the images that we craft. The eye-catching blobs and connectivity maps exist because of the particular way in which neuroscientists, magnetic resonance physicists, and data scientists decided to visualize and represent data from the brain.
Now I’m questioning whether I want to continue in this fraught field. Since graduating, I’ve turned toward my other passion, political advocacy and education in the Asian-American community. I joined two grassroots advocacy groups in California, one that organizes Japanese-Americans and another that builds cross-racial coalitions to fight discriminatory policies. Although I’m not probing people’s brains, I am learning about creating solidarity between ethnic groups with long histories of conflict and shared oppression. As a student, I had wanted to understand how the boundaries of in-group and out-group crystallize, and now I have a chance to observe and enact firsthand actions that regulate or expand who is included in a community.
Still, I keep my Google bookmark folder for cognitive science Ph.D. programs. I attend neuroscience lectures when I can. Maybe I’ll return, either as a scientist or sociologist of neuroimaging techniques. In opening the black box of the MRI machine, I may have fallen out of love with neuroimages, but at least now I see them for what they are.
Kelsey Ichikawa is a budding researcher with interests in the politics and ethics of science. She graduated from Harvard in 2020 with an A.B. in neurobiology and philosophy, and is currently based in California. You can follow her on Twitter @IchikawaKelsey
References
1. Golby, A. The FMRI25 Symposium (2017).
2. Wise, R.G. & Tracey, I. The role of fMRI in drug discovery. Journal of Magnetic Resonance Imaging 23, 862-876 (2006); Carmichael, O., et al. The role of fMRI in drug development. Drug Discovery Today 23, 333-348 (2018).
3. Eklund, A. Nichols, T.E., & Knutsson, H. Cluster failure: Why fMRI inferences for spatial extent have inflated false-positive rates. Proceedings of the National Academy of Sciences 113, 7900-7905 (2016).
4. Vul, E., Harris, C., Winkielman, P., & Pashler, H. Puzzlingly high correlations in fMRI studies of emotion, personality, and social cognition. Perspectives on Psychological Science 4, 274-290 (2009).
5. Williams, R. Research teams reach different results from same brain-scan data. The Scientist (2020).
6. Bennett, C.M., Miller, M., & Wolford, G.L. Neural correlates of interspecies perspective taking in the post-mortem Atlantic salmon. NeuroImage 47, S125 (2009).
7. Farah, M.J., Hutchinson, J.B., Phelps, E.A., & Wagner, A.D. Functional MRI-based lie detection: Scientific and societal challenges. Nature Reviews Neuroscience 15, 123-131 (2014).; Lowenberg, K. fMRI lie detection fails its first hearing on reliability. Stanford Law Review (2010).
8. Dumit, J. Objective brains, prejudicial images. Science in Context 12, 173-201 (1999).
9. Molero-Chamizo, A., Riquel, R.M., Moriana, J.A., Nitsche, M.A., & Rivera-Urbina, G.N. Bilateral prefrontal cortex anodal tDCS effects on self-reported aggressiveness in imprisoned violent offenders. Neuroscience 397, 31-30 (2019).
Lead image: Jackie Niam / Shutterstock