Political pundits have had some explaining to do since the Presidential election. FiveThirtyEight’s Nate Silver and other analysts have come under fire for assigning a high likelihood to Hillary Clinton’s victory—their predictions ranged from a 70 percent to 99 percent chance of her winning the Electoral College. Clinton’s loss prompted people to question the trustworthiness of polling data—and the statistical models that relied so heavily on it.
But to do so is at least a little bit naïve, says Andrew Gelman, a statistician and political scientist at Columbia University. “The polls were off by two percentage points,” Gelman says. Trump was expected to win roughly 48 percent of the two-party vote and ended up with nearly 50 percent. “It just happened to be that this election, two percentage points, plus the distribution of where those points occurred”—errors were greater in states with large populations of white people without college degrees, for example—“were enough to sway the outcome. It was a consequential two percent, but to say the models were far off isn’t quite right.”
“Next election, send all the pollsters off to a beautiful island. They can have a nice, long vacation.”
Statisticians assume a certain level of uncertainty in polls, based on how well their results represent the actual population of voters being sampled. Some of these errors can be calculated: The difference between what people tell pollsters in the sample and what the voting population at large actually thinks—what statisticians call sampling errors—can be minimized by increasing the sample size. There would be no room for sampling error if the sample were the entire population. But there are a slew of other errors, too, that wouldn’t go away, called non-sampling errors, which cannot be calculated and have nothing to do with the size of the sample. They are intrinsic to the method of data collection itself, and result from human error, deficiency in the data, and faulty analysis.
Take, for example, false responses: If everyone who said they’d vote for Trump actually voted for him, but only 97 percent of proclaimed Clinton supporters ended up voting for her (while the remaining percentage of votes went to Trump or third party candidates), the outcome could shift from initial predictions by whole percentage points.
Although analysis of the election results will probably continue for the next several months, if not years, the biggest culprits among the possible non-sampling errors this time around seem to be changes in voter turnout (there were people who voted for Obama who did not turn out to vote for Clinton this time, for example) and the failure to capture information about voters, especially Republican voters, who did not respond to polling surveys. As cell phones continue to replace landlines, pollsters find it increasingly difficult to get responses, since autodialing cell phones (a common polling practice) is prohibited and people are less likely to pick up calls from unknown numbers. And people who don’t respond to pollsters skew the data. “There’s always a chance something unanticipated can happen,” Gelman says.
But poll data’s unreliability hasn’t been a problem for Allan Lichtman, the political scientist who has been making headlines recently for accurately predicting election outcomes—including Trump’s victory—for more than three decades. He doesn’t think polling data should be the cornerstone of predictive analysis in elections at all. One reason is because polls are regularly wrong. “People have short memories,” Gelman says, “and they forget about the fact that polls have non-sampling errors.”
Another reason, Lichtman says, is that polls are just snapshots. “Polls are being misused and abused for what they’re not,” he says. “It makes for horse-race journalism. If you don’t probe deeply and don’t look at history, it’s just like a sporting event, with the polls keeping score.The compilation of data without a solid historical base and a theory is a dangerous trend.”
He examined presidential elections from 1860 to 1980 to determine the underlying forces at play in voting trends throughout United States history. “What I’ve found is that elections are primarily referenda on the strength and performance of the party holding the White House,” he says. “On voters deciding, should we give this party four more years?”
Lichtman developed a list of 13 true/false questions, or “keys,” about the incumbent party’s performance in the White House, based on factors such as the administration’s major policy changes, foreign policy successes and failures, the short- and long-term economy, midterm elections, and third parties. Their answers determine the likelihood of the incumbent party staying in office. Answers of “true” to any of the questions favor the incumbent party’s reelection; if the answers to six or more of the questions are “false,” the incumbent party loses. Using this analysis, it became clear to Lichtman that the Democrats were very vulnerable this election cycle, despite what all the polling said.
That’s why, Lichtman says, the news that so many people focused on as game-changers—from the leaked tape of Trump’s supposed “locker-room talk” to James Comey’s letter about the FBI’s Clinton email investigation—did not end up carrying as much weight as people thought they would. “People are saying that things would be different if only we had Sanders or Biden” running against Trump, Lichtman says, “but that’s nonsense. Clinton was a good candidate. A bad candidate doesn’t win all the debates. We can’t point the finger at her or her campaign.
“The lack of a big splashy success in foreign policy like Osama bin Laden in Obama’s first term, no major policy accomplishments in Obama’s second term, third parties polling beyond what third parties polled in 20 years, Clinton being a good candidate but not a once-in-a-generation inspirational candidate like JFK or FDR,” Lichtman goes on, strongly hinted at what was coming. “I made my prediction [that Trump would win] back in September.”
That’s not to say that polling data can’t be useful, he says. It can help determine whether a third-party candidate is likely to become significant in a given election cycle, or be used to assess public opinion on presidential initiatives (Lichtman cites the Iran nuclear deal by way of example). But polls have no place in helping to predict outcomes in national elections, and should not be used to do so in the media’s elections coverage, he says. “Next election, send all the pollsters off to a beautiful island. They can have a nice, long vacation.”
Jordana Cepelewicz is an editorial fellow at Nautilus.
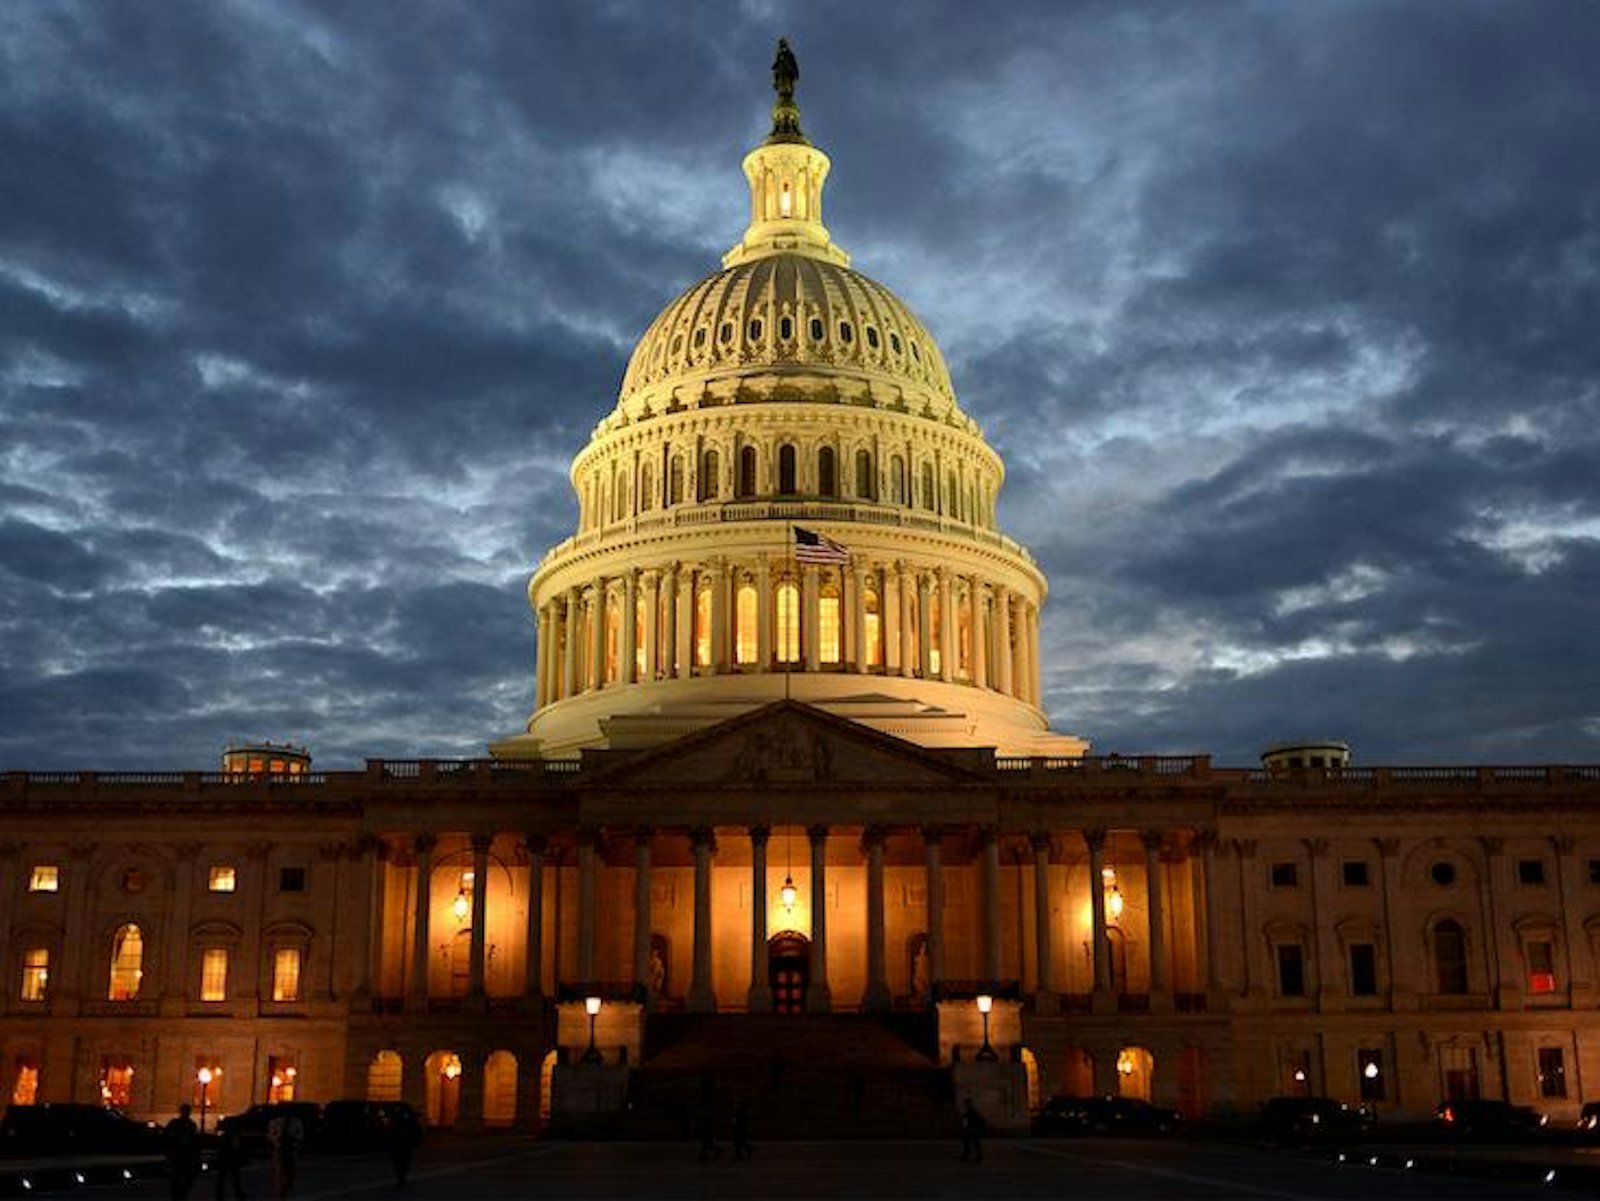
The lead photograph is courtesy of Stephen Melkisethian via Flickr.


