

We all want to get back to our lives—go out for a drink, see a movie, hug our parents and grandparents, and bring our cities back to life. When will the virus be under control? And how do we measure that?
Much of the media coverage of COVID-19 talks about R0 or “R-nought,” the average number of people each sick person infects. If R0 is bigger than 1, cases grow exponentially, and an epidemic spreads across the population. But if we can keep R0 below 1, we can limit the disease to isolated outbreaks and keep it under control. This has produced a flood of websites that estimate R0 in each country or each state, treating R0=1 as the definition of success.
We talk of “superspreaders” as individuals with high viral loads. It’s more accurate to talk about superspreading events.
But R0 is only an average. Your ability to practice social distancing depends on whether you are a first responder or health care worker, whether you have to work in close quarters, or whether you can work comfortably from home. (I’m one of the lucky few who get paid for writing this from my garden.) It depends on how seriously you take your government’s warnings, and how seriously your government takes the warnings of public health experts. And it depends on the structure of your family and your home.
As a result, R0 varies wildly, not just from region to region, but across social space as well. In New Mexico, Santa Fe has very few new cases, but there is an explosion of cases in rural, low-income areas. As of May 12, 57 percent of our confirmed cases are Native American, even though that community forms just 11 percent of the state’s population. Clearly R0 is larger in some parts of the state and of society than others.
And even if R0 is less than 1, outbreaks can be surprisingly large. Suppose you meet 10 people while you are infectious, and that you infect each one with probability 8 percent. The average number of people you infect is 10×0.08 = 0.8, less than 1. But those you infect may infect others in turn, and so on. If an outbreak starts with you, how many “descendants” will you have? A classic calculation shows that, if R0=0.8, then the average number of people in this chain reaction is 1/(1–0.8)=1/0.2=5. But like R0 itself, this is only an average. Like earthquakes and forest fires, outbreaks have a “heavy tail” where large events are common.
Here is a visualization of 100 random outbreaks. The average size is indeed 5, and most outbreaks are small. But about 1 percent have size 50 or more, 10 times the average, and in this simulation the largest of these 100 outbreaks has size 82. This tail gets heavier if R0 is just below the critical point R0 =1. If R0=0.9, the average outbreak size is 10, but 1 percent have size 140 or more.
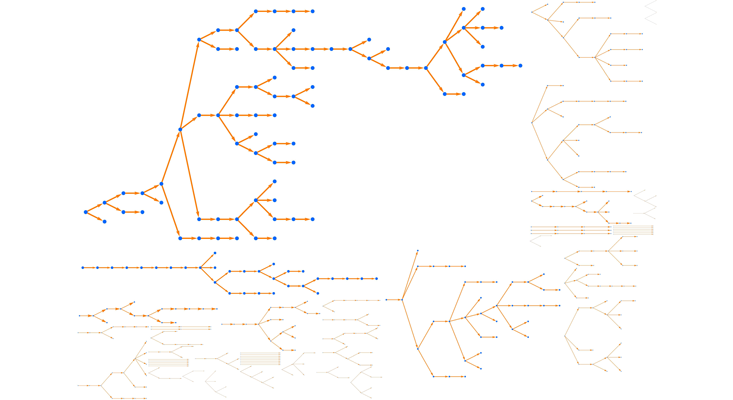
This tail has real effects. Imagine 100 small towns, each with a hospital that can handle 10 cases. If every town has the average number of cases, they can all ride out the storm. But there’s a good chance that one of them will have 50 or 100, creating a “hot spot” beyond their ability to respond.
The tail of large events gets even heavier if we add superspreading. We often talk of “superspreaders” as individuals with higher viral loads, or who by choice or necessity interact with many others. But it’s more accurate to talk about superspreading events and situations—like the Biogen meeting, the chorus rehearsal, or the pork processing plant, as well as prisons and nursing homes—where the virus spreads to many of those present.
Suppose that 20 percent of cases generate one new case, 10 percent generate two, 4 percent generate five, and 1 percent “superspread” and generate 20 (and the remaining 65 percent infect no one). The average number of new cases is again R0=0.8. Let’s generate 100 random outbreaks with this new scenario.
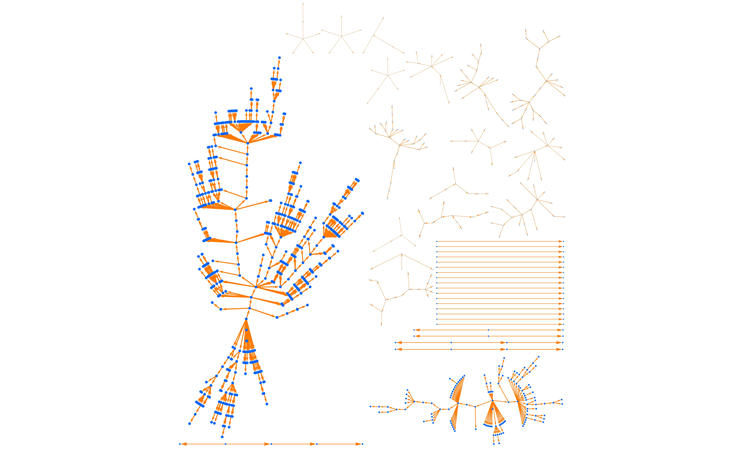
The average outbreak size is still five, but now the tail is much heavier. If just one of the 100 original cases is involved in superspreading, we get a large outbreak. If there are several generations of superspreading, the size multiplies. As a result, large outbreaks are quite common, and the largest one in this simulation has 663 people in it.
What does all this mean? First, it can be misleading to look at statewide or national averages and celebrate if R0 seems to be falling below 1. The epidemic could still be raging in particular places or among particular groups.
Second, even if we can hold R0 below 1, we need to prepare for hot spots. Even if the average outbreak is small, large outbreaks will occur, due to superspreading or simply by chance. If we do a fantastic job at testing and contact tracing—using both technology and human effort—we will get this pandemic under control, but for the foreseeable future there will be times and places where it flares up and strains local resources. Through these flare-ups, we have to do our best to help each other, and hope that intelligent, generous voices prevail.
Cristopher Moore is a professor at the Santa Fe Institute. He has published over 150 papers at the boundary between physics and computer science, including the theory of social networks and algorithms for analyzing their structure. He is an elected fellow of the American Physical Society, the American Mathematical Society, and the American Association for the Advancement of Science. With Stephan Mertens, he is the author of The Nature of Computation.
This article is from the series, “Transmission: SFI insights into COVID-19,” originally published by the Santa Fe Institute.
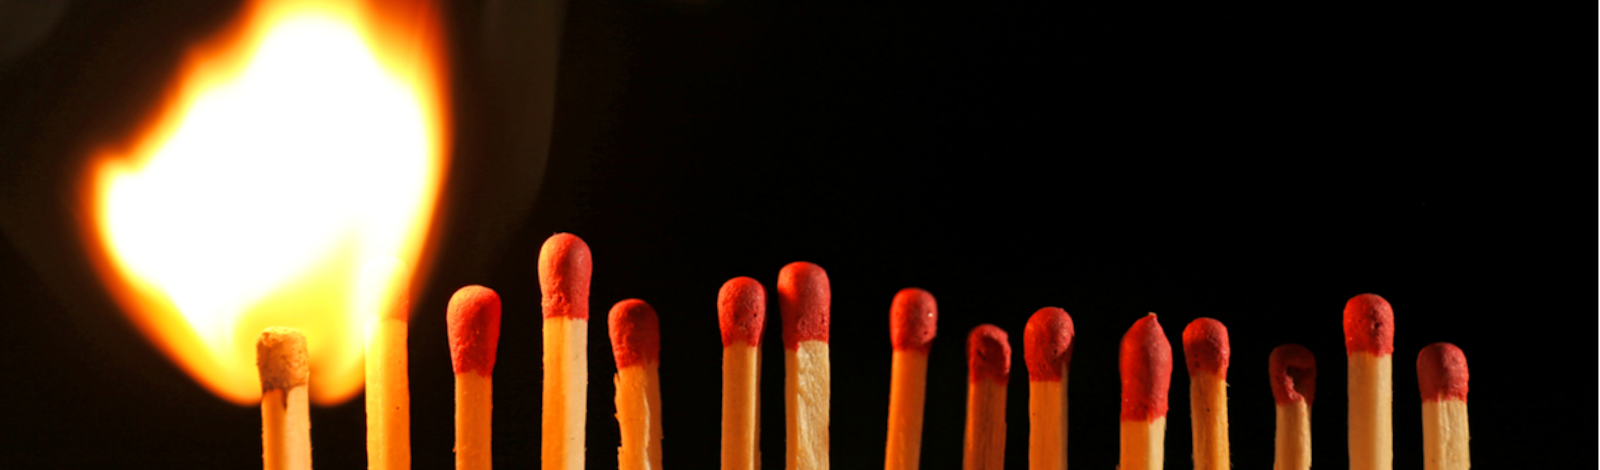
Lead image: Africa Studio / Shutterstock
Additional Reading
Hébert-Dufresne, L., Althouse, B.M.,Scarpino, S.V., & Allard, A. Beyond R0: Heterogeneity in secondary infections and probabilistic epidemic forecasting. https://arxiv.org/abs/2002.04004 (2020).
Lloyd-Smith, J.O., Schreiber, S.J., Kopp, P.E., & Getz, W.M. Superspreading and the effect of individual variation on disease emergence. Nature 438, 355–359 (2005).