

The burial detail, which had come for the corpses in the pigpen, was surprised. The “dead” were getting up and speaking English. Qu’est-ce que c’est? Ah, they were an ambulance crew. British volunteers, in the trenches with the French Army on the Western Front. In the ruins and wreckage near the front lines, they’d found nowhere else to sleep.
The medical corpsmen were all pacifists, serving humanity even as they refused to serve in any military. Still, they lived like the troops. They bunked in rat-infested dugouts, on the floors of shelled buildings, in hay-filled barns. They dove for cover when incoming shells moaned and screamed, and struggled with their masks when the enemy fired gas canisters. At any moment, they could be called to go to the front lines, gather wounded men, and drive—lights off on roads cratered by shells, packed with trucks and troops, with every jostle making the blood-soaked soldiers in the back cry out in pain—to a hospital.
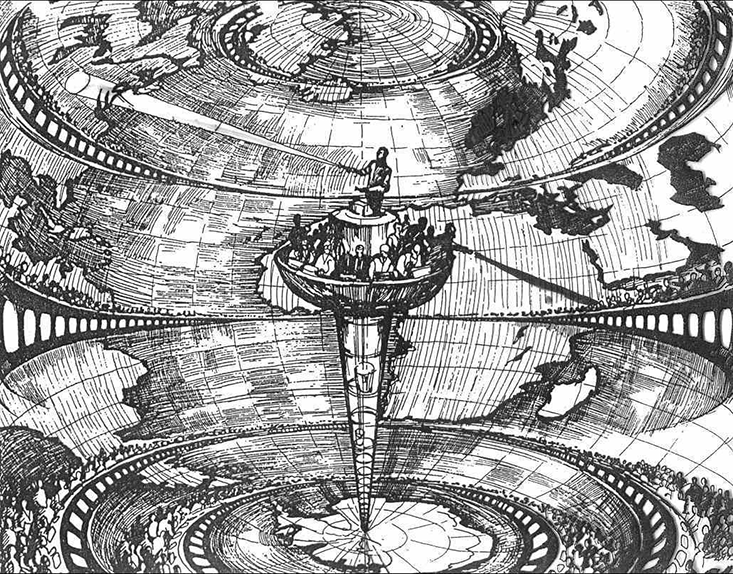
It was the last place in the world to look for a scientist at work. Yet one soft-spoken corpsman, known as “Prof,” filled his downtime with experiments and calculations. “We thought nothing of seeing him wandering about in the small hours checking his instruments,” one of his fellow corpsmen recalled. Once, for example, he’d set a bowl of water on a record-player he had somehow got hold of, cranked up the machine, and measured the radius of the curve on the water’s surface. A rotating fluid, he thought, might serve as a useful model of the atmosphere. (Though his record player wasn’t up to the task, later work would prove him right.)
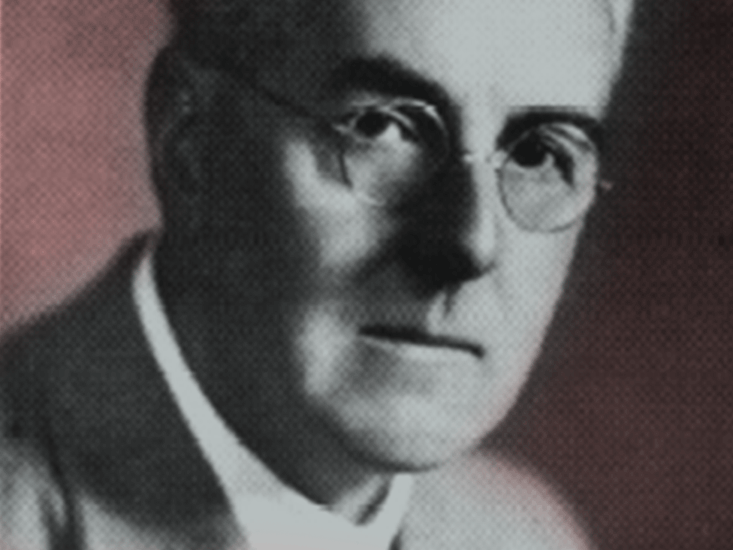
“Prof” was the English physicist and mathematician Lewis Fry Richardson, for whom doing science came as naturally as breathing. “It was just the way he looked at the world,” recalls his great-nephew, Lord Julian Hunt. “He was always questioning. Everything was an experiment.” Even at the age of 4, recounts his biographer Oliver Ashford in Prophet or Professor? Life and Work of Lewis Fry Richardson, the young Lewis had been prone to empiricism: Told that putting money in the bank would “make it grow,” he’d buried some coins in a bank of dirt. (Results: Negative.) In 1912, the now-grown Richardson had reacted to news of the Titanic’s sinking by setting out in a rowboat with a horn and an umbrella to test how ships might use directed blasts of noise to detect icebergs in fog. (Onlookers might have shaken their heads, but Richardson later won a patent for the fruit of that day’s work.) Nothing—not fellow scientists’ incomprehension, the distractions of teaching, or even an artillery bombardment—could dissuade him when, as he once put it, “a beautiful theory held me in its thrall.”
Many scientists would not publish such a resounding dud of an experiment. But the Quaker and scientist in Richardson valued plain honesty over self-promotion.
In 1916, two beautiful ideas gripped Richardson’s attention. At the heart of both was the complex interplay of predictability and randomness that is turbulence.
His first idea was rooted in his principles as a Quaker pacifist who believed “science should be subordinate to morals.” Everyone spoke of this Great War as if it had been a catastrophic surprise. Who could predict a lone assassin in Sarajevo? Or that the belligerents would not find a way to defuse the crisis, as they had before? Or that plans for a quick victory would sour into this stalemate in the trenches? War, Richardson thought, far from being an unforeseeable accident, might instead be the consequence of as-yet-unknown laws operating on measurable facts. Beneath its seemingly random and chaotic course were the regular patterns of these laws. With the right data and the right equations war might be predictable—and thus preventable. He believed that humanity could some day avoid war as ships could some day avoid hidden icebergs.
Whenever he could, in quiet moments or when his ambulance corps was rotated to the rear for a rest, Richardson worked on a long paper on “the mathematical psychology of war.” (“I remember him telling me, ‘let x be the will to hate,’ ” recalled one of his less equation-oriented friends in the unit. “It beat me!”)
But it was Richardson’s other great idea that would come to fruition first, and make him famous. In fact, after many decades of obscurity it would come to be appreciated as one of the most significant technologies of the 20th century. At the front lines, and in the rest billets where the corps was rotated out for a break every few weeks, Richardson was looking for a way to forecast the weather.
At the turn of the last century, the notion that the laws of physics could be used to predict weather was a tantalizing new idea. The general idea—model the current state of the weather, then apply the laws of physics to calculate its future state—had been described by the pioneering Norwegian meteorologist Vilhelm Bjerknes. In principle, Bjerknes held, good data could be plugged into equations that described changes in air pressure, temperature, density, humidity, and wind velocity. In practice, however, the turbulence of the atmosphere made the relationships among these variables so shifty and complicated that the relevant equations could not be solved. The mathematics required to produce even an initial description of the atmosphere over a region (what Bjerknes called the “diagnostic” step) were massively difficult.
To get a forecast without stumbling on the impossible calculus of the differential equations, Bjerknes represented atmospheric changes using charts. For example, as the historian Frederik Nebeker explains in Calculating the Weather: Meteorology in the 20th Century, the chart might show more air flowing horizontally into a region than out, allowing the forecaster to predict that the remainder of the incoming air is flowing upwards in the form of vertical winds.
As it happened, since Richardson’s graduation from Cambridge in 1903, he had confronted similarly difficult equations as he moved restlessly among posts in academia and industry. Analyzing stresses in dams and the flow of water through peat, he had developed a different work-around.
Only differential equations, with their infinitely small quantities changing over infinitely small units of time, described the continuous change he wanted to model. But since those equations couldn’t be solved, Richardson reworked the math to replace the infinitesimals of calculus with discrete measurements occurring at discrete time intervals. Like a series of snapshots of a ball flying through the air, Richardson’s “finite difference” equations only approximated the reality of the constant change they described. But they could be solved, with simple algebra or even arithmetic. And their solutions would be far more precise than any obtained with a chart.
The Richardson number is used today to predict where turbulence will occur in both the atmosphere and the ocean.
Richardson’s finite-difference work had been too novel and unfamiliar to win him a research post at a major university. But in 1913, it helped get him a plum job: directing a research laboratory for Britain’s Meteorological Office, which hoped Richardson would bring both rigorous thinking and practical lab skills to the search for accurate weather forecasts. Here, with a good salary, a house to himself, and a lab far from any distractions, he would have ample time for research.
The following year, however, the Great War arrived. At age 32, with his important research ongoing, Richardson could have kept to his agreeable job. Yet even as his principles would not permit him to serve in the military, he still felt he should take part in the war. “In August 1914,” he later wrote, “I was torn between an intense curiosity to see war at close quarters, an intense objection to killing people, both mixed with ideas of public duty, and doubt as to whether I could endure danger.’’ Rebuffed when he requested a leave of absence to serve in the ambulance corps, in 1916 he simply quit. A few weeks later, he and his slide rule, notes, and instruments were at the front.
And so for the next few years Richardson’s theories of war and weather advanced in and around the combat zone. Over six weeks in 1916, with a bale of hay for his desk, Richardson patiently solved equation after equation for hundreds of variables. His aim was to demonstrate his method of “weather prediction by numerical processes” by creating a real forecast.
Richardson decided to do a “hindcast,” so his results could be compared with real weather on a target date in the past. He chose the weather over Central Europe on May 20, 1910—a date for which Bjerknes had already published a trove of data about temperature, humidity, barometric pressure, and wind speed.
Richardson created a map of the atmosphere over the region, split into 25 equal-sized cells with sides of about 125 miles. Every block was further divided into five layers with about the same mass of air in each layer. (Because atmospheric density decreases with altitude, these layers were divided at heights of 2, 4, 7, and 12 kilometers above the ground.)
Richardson divided the 25 big blocks into two types: P cells, for which he recorded the atmospheric pressure, moisture and temperature; and M cells, for which he calculated wind speed and direction. He alternated P and M cells on his grid, creating a sort of checkerboard. He could calculate the “missing” data for each cell by looking at the data of cells adjoining it. (For example, wind speed in an M cell could be deduced by pressure changes in the P cells that surrounded it.) Plugging all the available data from 7 a.m. into the equations, then patiently solving them for a time six hours later, he arrived at a “forecast” for conditions at 1 p.m.
Results: Negative. The recorded weather for the day showed Richardson’s “forecast” was wrong. He had predicted a dramatic shift in wind speed and direction that didn’t happen. He had also predicted a freakish rise in atmospheric pressure over Munich. In fact, the barometer had held steady that day.
Many scientists, then and now, would not publish such a resounding dud of an experiment. But the Quaker and scientist in Richardson valued plain honesty over self-promotion. And he believed the merit of the method would be obvious even if the first practical application needed work. When he published Weather Prediction by Numerical Processes in 1922, he described his disappointing results, in great detail.
Perhaps, Richardson wrote, the weather-balloon measurements he’d obtained were simply wrong. Or perhaps the gaps between measuring stations were too great (the finite-difference method needed sufficiently fine-grained data to approximate the continuous changes in weather, just as an adequate number of snapshots would be needed to portray the continuous motion of a ball). Another suspect was the need to interpolate data in cells where it was lacking. In fact, a few years ago, Peter Lynch of the Irish Meteorological Service showed that the trouble was simply that 1910 data-collection methods failed to correct for minor noise in the data. Richardson couldn’t prove it, but his model worked.
But there was another source of potential error, which Richardson realized required further research: the turbulence that knocked air out of predictable paths, sending eddies of air up or down or sideways, where they banged into other eddies, passing energy from whirl to whirl. Air that gets knocked around like this further disturbs the flow of things by creating smaller local currents that move in the opposite direction from the main stream. Finally, at the smallest scale, too little energy is left to overcome viscosity—the resistance to motion created by friction between individual molecules of air. More poetically, in the chapter devoted to turbulence in Weather Prediction by Numerical Processes, Richardson explained it this way: “Big whirls have little whirls that feed on their velocity; and little whirls have lesser whirls, and so on, to viscosity—in the molecular sense.”
As Hunt explains in his introduction to Richardson’s collected papers, in the first decades of the 20th century meteorologists didn’t have a good grasp of turbulence, especially as it affected movements of air in the first 2 kilometers of the atmosphere. Turbulent eddies in this layer are crucial to weather prediction, because they carry heat and moisture up into the higher atmosphere and down toward the surface of the earth, shaping the weather.
For instance, Richardson had observed how fluctuations in wind speed seemed to depend on the difference in wind speeds at different heights and the difference in temperature at those heights. When ground temperature fell, resulting in a greater difference between ground temperature and temperatures higher up, wind fluctuations became less frequent. He concluded this was due to buoyancy forces caused by eddies moving through different temperature zones interacting with eddies moving through regions of different wind speeds. He devised an equation to predict the occurrence of turbulence based on a ratio of these two effects. As Giles Foden has written in Turbulence, his novel inspired by Richardson’s work, the equation “dramatizes the relationship between wind and heat.”
Where others looked at war and saw only unpredictable turbulence that math could not master, Richardson saw measurable quantities and inexorable laws.
That ratio of heat energy to wind energy, now called the Richardson number, is used today to predict where turbulence will occur in both the atmosphere and the ocean. When the ratio is high, warmer air is adding energy, making more and larger eddies. Because the whirls of turbulence can be hundreds of miles wide or small enough only to bother a gnat, the Richardson number is “dimensionless”—it is not associated with any particular quantity. In other words, for turbulence, scale does not matter, as the same patterns are seen in the smallest and largest instances.
Of course, we experience turbulence differently when it is blowing a dust mote around than when it is creating a massive storm. Turbulence is, in fact, in the eye of the beholder. A pilot flying through eddies too small to bump his plane around will not notice them—the effect of all the tiny eddies is averaged out into a general sense that the ride is smooth. On the other hand, neither will he notice an enormous eddy that enfolds the entire plane, any more than a fish would notice the water in which it swims. As Richardson writes in Weather Prediction, a pilot who calls the air “turbulent” is noticing eddies that occur on a scale about the size of one airplane wing. In this sense, as Foden observes, “every so-called ‘accident,’ every piece of turbulence, is part of a sequence, bigger or smaller, whose scale you cannot see.”
Richardson’s turbulence research was quickly recognized in the 1920s, but his greatest meteorological insight—his forecasting method—was considered a failure. It was too difficult to do in real time, many thought, and it had not produced an accurate prediction. His proposal languished for decades before technology caught up with it. Only after the advent of computers capable of doing quick calculations did his numerical-process approach become the standard method for forecasting. Today, his technique remains the basis for weather forecasts and climate modeling.
Richardson often suffered from this sort of scientific “prematurity,” as the mathematician and father of fractal geometry Benoit Mandelbrot put it. Mandelbrot knew this firsthand. In his quest to understand the role national boundaries play in causing wars, Richardson had written a paper on the difficulties of measuring national coastlines. He did not realize he was wrestling with the fact that coasts are fractals—twisty irregular shapes that are the same at any scale, from an inch to a mile. Mandlebrot, however, saw that Richardson had supplied him with a practical case for the importance of such fractals, and wrote his first major paper on the subject as a result.
“People in the classic turbulence world and the diffusion world and the differential equation world didn’t begin to appreciate what he had done until the 1940s,” said Hunt, who is also a climate modeler and meteorologist. But by the time Richardson’s achievement in meteorology was recognized, most of his attention had shifted to war.
Though Richardson had returned to work for the Meteorological Office in 1919, he only stayed for one year. In 1920, a government reorganization placed the agency under the Air Ministry, which was in charge of the Royal Air Force. As his conscience would not allow him to work for any military organization, Richardson felt duty bound to resign. His breakthrough work on turbulence in the 1920s was conducted in his spare time, as he supported his wife Dorothy and their three adopted children with a professorship at a teacher’s college. The war had marked him—one of his children recalls Richardson screaming in terror at sudden loud noises, and explaining that he had “shell shock”—and his concern for understanding collective violence was growing. By the end of the 1920s, he had enrolled in university to study psychology. In the next few years, war replaced the weather as his main focus.
For two decades before his death in 1953, Richardson painstakingly collected data about arms races, economic upheavals, insurgencies, revolutions, riots, and combat. “He was all the time compiling statistics about conflicts around the world,” Hunt recalls from boyhood holidays with his great-uncle. “Letters would keep pouring in from friends and colleagues and relatives. He had these deep ideas, but he was all the time looking at data.”
Where others looked at war and saw only unpredictable turbulence that math could not master, Richardson was once again looking for measurable quantities and inexorable laws that could be modeled with equations. His goal was to build a model of the current state of political and economic tensions among nations—with measurements for “war weariness,” “internationality” (roughly a nation’s engagement with other countries, partly derived from figures about its international trade), and “preparedness for war” (a function of economic data and spending on arms and defense).
As with his weather work, he was producing papers, but also working toward another magnum opus. Posthumously published in 1960, The Statistics of Deadly Quarrels, would, he hoped, help people set aside the illusions and self-serving jingoism that passed for analysis, and see, as he put it, “what has happened often is likely to happen again, whether we wish it or not.” Any attempt at a science of war would have its flaws and blind spots, but at least it would offer some much-needed clarity.
After all, then as now, most of what passes for analysis of wars and conflict consists of talk about one individual eddy or another in the vast political atmosphere. Changing relationships among world leaders, individual skirmishes and attacks, armistices, and so on are the kind of events that “may be likened to the eddying view of a wind,” Richardson wrote. His theory, by contrast, would offer a way to step out of our local turbulence, and see the larger patterns.
As he had in meteorology, Richardson sought hard data—measurements that would not vary with the politics or passion of the observer. Any interpretation would be clouded by bias. He wrote: “counting is an antiseptic against prejudice.” He would ignore disputes about who was a terrorist and was a freedom fighter, and whether a military action was a fight for freedom or a bandit raid. Instead, he would simply count the dead.
A “deadly quarrel,” Richardson decided, was to be defined as any conflict in which a person’s death was deliberately caused by another. He toted up “deadly quarrels” of every type from 1820 onward. (He had planned to review a century’s worth of data, and he picked starting and ending dates that marked relatively peaceful times following great wars. Later, he extended the dataset to include the violent 1930s, ’40s and the start of the ’50s.)
He then sorted his “deadly quarrels” the way geologists classify earthquakes, ranking each “quarrel” according to the base-10 logarithm of the number of deaths it produced. The base-10 logarithm of a number describes how many times 10 must be multiplied to produce that number. A riot that leaves 100 dead in this system has a magnitude of 2 (the base—10—must be multiplied by itself to yield 100). And a conflict that kills 10 million people has a magnitude of 7 (multiplying seven tens will yield 10 million). Defining “deadly quarrels” on a logarithmic scale also served Richardson’s project to get people thinking about violence without illusion. Like the Richter scale for earthquakes, his logarithmic graphs let the reader see all quarrels, from murders to global war, as a single phenomenon on a single scale.
Something interesting emerges from those figures. As the atmosphere is full of small eddies, so humanity experiences many small deadly quarrels, which result in a few fatalities. But now and again come huge storms, which kill millions. These are just the sort of outbreaks, like the world war Richardson had seen for himself, that people think of as surprising. Yet when Richardson plotted the frequency of wars against the number of deaths caused by each one, he found a constant and predictable relationship. On his graphs, the violence obeyed a “power law”—a constant relationship between the size and frequency of measurements. In his turbulence work, Richardson had found that such a power law governed the relationship between the rate of diffusion of objects in a turbulent stream and their distance from one another. Now he had found evidence of an underlying law in the supposedly unpredictable realm of politics.
Anyone might observe that extremely big wars were much more rare than “deadly quarrels” that killed only a few people. But the power law relationship suggested that the giant wars were just as predictable as the smaller ones. Like giant earthquakes (which also obey a power law), giant wars were not appalling surprises, arising out of unique circumstances. They appeared to be roughly predictable.
This finding was long considered a curiosity in peace research. However, over the past 10 years, a number of researchers have found power law relationships in modern statistics about violence. Neil Johnson, a physicist at the University of Miami, Michael Spagat, an economist at Royal Holloway University of London1, and their co-authors have found a similar power law in data about both conventional war, terrorist attacks, and cyber-attacks. These findings offer some suggestions as to when future attacks are most likely to occur, and when it would be most effective to try to prevent them. And they offer a starting point for the quest for an underlying law governing outbreaks of violence once considered too complex and idiosyncratic to predict.
War, Richardson taught us, can be as out of our control as a summer thunderstorm. The least we might do is check the forecast.
David Berreby, the author of Us and Them: The Science of Identity, writes the Mind Matters blog at Bigthink.com.