


Let me tell you the tale of two Nobel Prizes—well, almost. The first Prize I want to tell you about was awarded to Wilhelm Röntgen in 1901 for the discovery of X-rays. The details of this discovery are fascinating in their own right, but the salient point for us is that Röntgen was not looking for X-rays at all. Instead, he was studying the behavior of various types of vacuum tubes. The unexpected shimmering of a piece of his equipment that contained barium made him suspect that something unusual was happening. He was in Stockholm to collect his medal within six years.
The second Nobel Prize I want to tell you about is different in two important ways. First, it hasn’t been awarded yet, and may never be. Second, it involves what is, in some sense, the opposite of an unexpected discovery. The scientists involved knew what they were looking for: an exceedingly rare particle produced when two protons are smashed together. In fact, only once in about 10 billion collisions does this particle occur. As a result, far from taking into consideration an unexpected data source like Röntgen did, they threw away 99.995 percent of their raw data because it was too voluminous to be recorded. I’m talking about the discovery, on July 4, 2012, of the Higgs boson.
The Higgs represented one of the most important physics discoveries in decades: the final piece of the so-called Standard Model of particle physics, which describes the elementary particles and their interactions. It was also a triumph of big science. The Higgs experiment at the Large Hadron Collider (LHC) at CERN, the European Organization for Nuclear Research near Geneva, Switzerland, generated tens of petabytes of data, demonstrating a computational prowess unprecedented in the history of particle physics. It was positive proof that science driven by big data could extend our observational sphere in important ways. But, by requiring scientists to begin experiments with a rough idea of what they are looking for, did it also alter how we think of accidental discoveries, of the type that led not just to X-rays, but also to positrons, superconductors, and the fractional quantum Hall effect? The answer is a subtle one.
Observing a Higgs boson requires an enormous amount of data gathering, for three simple reasons: First, it is produced by colliding protons together, but the vast majority of collisions (all but about one in 10 billion) fail to produce a Higgs. Second, once a Higgs boson is produced, its decay products might be buried in a spray of similar-looking signals resulting from the collision, and might not be noticed. Finally, the particle physics community demands a “five-sigma” level of certainty before claiming a discovery (meaning that the chances of the observed signal being a statistical fluke are 0.005 percent or less). This is an impressive standard—if we held recorded U.S. presidential election votes to that standard of accuracy we might never know the result of an election, or we could be stuck in an indefinite recount process.
A rough calculation shows that even for the enormously high density of colliding proton bunches circulating 12,000 times per second around the LHC, a realistic Higgs boson production rate results in only one Higgs boson being produced every 10 seconds. While that may sound like a lot, we cannot observe the Higgs directly. As soon as it is created, the Higgs decays into a variety of “common” particle pairs. These can include: bottom quarks and their anti-quarks, W bosons, gluons, taus, Z bosons, charm quarks, and pairs of photons. These common particles are what the detectors actually observe (although some of them also decay into electrons, muons, and photons). The trouble is that these same decay products are also produced by a long list of other interactions, including the direct production of quark jets, W bosons, and Z bosons. These types of “background signals” are more than ten times the strength of the Higgs signal.
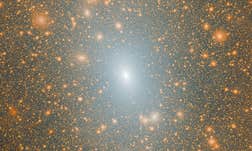
This makes the Higgs boson the proverbial needle in a yellow haystack, with a twist. Instead of a needle, imagine we are looking for green grass cut from a specific field (let’s call it the “Higgs field”) that is manicured so neatly that every blade is exactly the same length—say, 2.5 inches. Also scattered throughout the haystack are flowers, weeds, and green grass cut from many different fields, some of which are uncared for (let’s call these the “background fields”) and therefore come in all possible lengths. How would you be able to prove that the haystack contained green grass from the Higgs field—and thus that the Higgs field existed?
What we physicists would do is to quickly sift through the haystack and throw out the weeds and the yellow hay, leaving green blades of grass that we would arrange by size. This would allow us to observe an excess of 2.5-inch blades and conclude that the Higgs field exists. Now, bearing in mind the story of Röntgen and his discovery of X-rays, we might be tempted to try to keep all of the weeds, hay, and flowers. After all, who knows what other physics it might contain, and what accidental discoveries it might lead to?
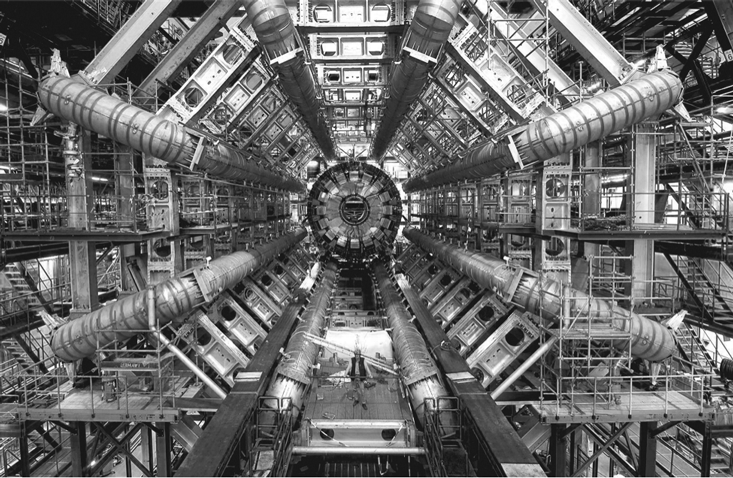
To appreciate why we can’t keep all this data, consider what generates it. The ATLAS detector is one of the largest scientific instruments ever built: A cylinder 15 stories tall and eight stories in diameter, filled with liquid argon and with very large magnetic fields, ATLAS produces a 100-megapixel image every 50 nanoseconds. If we were set on keeping all of that data, we would need to record about 40 terabytes of data per second. To put this into perspective, that would be like recording four times the world’s total Internet capacity to disk, continuously, for the duration of the experiment—which is a decade or longer.
Instead, we burn the hay. Most—in fact, almost all—of the data from the Higgs experiment is discarded as uninteresting. Does this mean we can’t make accidental discoveries? Not necessarily. We try hard to keep anything that looks interesting. To do so intelligently, all large particle physics experiments use a “trigger” system that quickly evaluates whether any given picture is worth keeping. It’s rather like taking a quick glance at your just-taken digital photo to see how it turned out. The trigger system is composed of a nested series of ever-more sophisticated, and correspondingly slower, algorithms that gradually weed out uninteresting pictures.
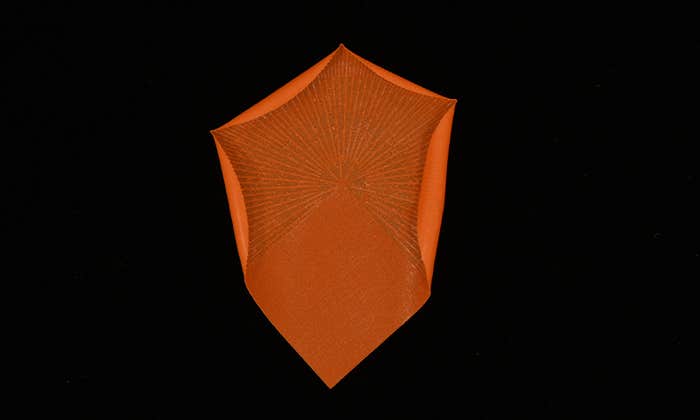
Using sophisticated detector simulations, we test the efficiency of these algorithms to assure ourselves that they are not discarding interesting pictures. This is not always easy. For example, consider the following two pictures.
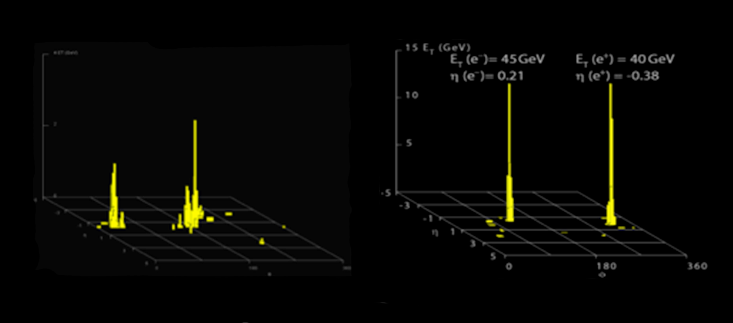
The picture on the left is of two quarks produced in a proton-proton collision, which is very common and not especially interesting. The quarks turn into “jets” of particles that are represented by the two yellow towers. The right-hand picture shows a Z boson decay into an electron and a positron (the anti-particle of an electron), which is much more rare, and much more interesting. It could be a sign of unexpected physics, because it suggests that the Z boson is as heavy as 90 protons (in fact not too different from the mass of a Higgs boson). But on a cursory examination, the two pictures appear very similar: two towers of yellow.
A good algorithm will be able to pick the picture on the right as interesting, and keep it, while discarding the other. It might observe that the left picture’s towers are spread out, while those in the right picture are pencil-thin. Or that the left picture has a jet in it, and the right picture has an electron in it. These subtle differences can be picked up by calculating the mass of the original pre-decay particles based on the energy and direction of the decay trajectories in each set of data.
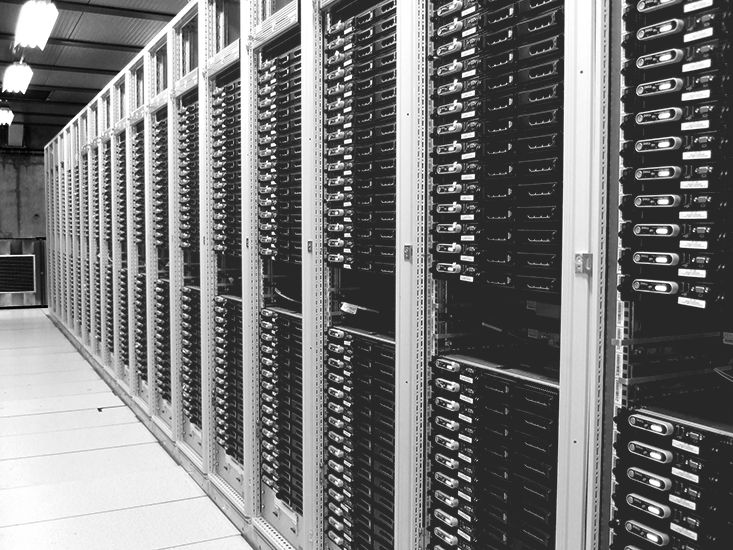
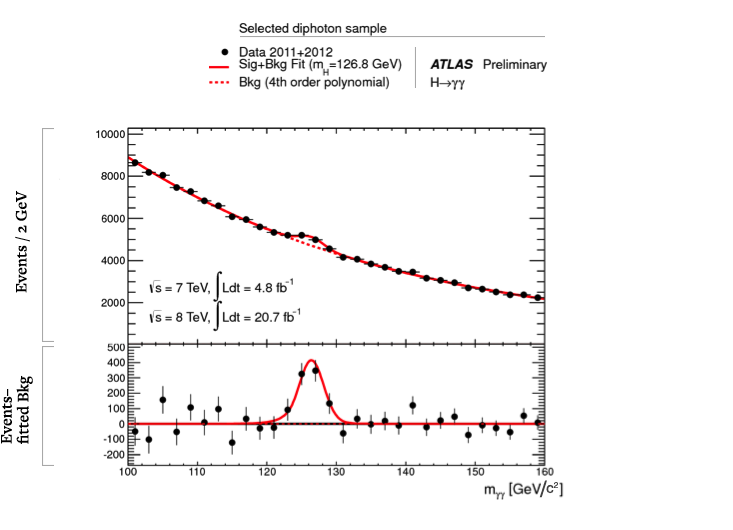
We are able to accomplish analyses like this with enormous computing power: About a billion megaflops of power are dedicated to filtering alone. And, for discovering the Higgs, it worked beautifully. After filtering, we brought to bear a vast computer network of about 100,000 processors distributed in computing centers around the globe. For each collision, we calculated the mass of the parent particle from the combined mass of the observed decay particles (among other quantities). In most cases, we were wrong to do so, because the decay particles did not actually issue from a single parent. This means the mass we calculated was essentially random, producing a background distribution to our measurements. Occasionally, however, the observed decay particles did come from a single parent particle, such as a Higgs boson decaying into two photons. By accumulating enough data, we saw a “bump” at the unique mass of the Higgs boson, sitting on top of a smooth falling background distribution from all the “wrong” pairs for which we had calculated a mass. That bump was at a mass of 125 GeV/c2, as illustrated below.
Filtering out uninteresting data, then, is difficult, yet it works. But there is an even more difficult question, and that is to decide what exactly “uninteresting” means. Certainly, large energy deposits are interesting (the yellow towers in Figure 2), because they indicate the presence of rare particles. Energy that is missing is also interesting (remember that energy conservation is a key principle of physics), because it suggests the existence of particles that escaped our detector without leaving a trace. These could be ghostly neutrinos or, even more exciting, supersymmetric particles that have been postulated to exist, but not yet observed. And evidence of decay products (electrons, photons, muons and so on) is considered interesting because it might be the result of new, as-yet-undiscovered rare particles.
But all of these “interesting” events are defined within a particular framework of understanding. If we’d asked Röntgen to write down all of the possible interesting results of his 1901 experiment, the scintillation of a barium experimental component from X-ray exposure would not have been on the list. Similarly, it is possible that the millions of petabytes of data discarded from the LHC contain brand-new physics that we are ignoring. A new and unexpected particle decay could be thrown out by the trigger if it were too weird, or deceptively ordinary looking.
In the realm of the too-weird might be something like evidence for the violation of energy conservation, where protons collide and then some or all of their energy vanishes—certainly not anything I would expect, but also something that would be very difficult to ever observe with the current trigger systems. That’s because there would be no signature to look for. If we carefully monitored the number of collisions we expected, only to find there weren’t as many as we expected, we might clue in to those missing collisions, but this a very difficult or perhaps even impossible measurement to make. Also hard to catch would be some new type of particle that has a relatively long lifetime before it decays. This would mean that it would decay into visible particles in the middle of our detector. Our trigger systems are designed to focus on particles that point back to the center of the detector, not ones that pop up unexpectedly in the middle.
On the too-ordinary front, let’s return to the haystack analogy. Suppose that an excess of yellow hay with a length of 2.5 inches means something (I’d tell you what, but I don’t know!). Well, remember that to avoid the near-impossible task of sifting through the whole haystack, we burned all the yellow hay. So such an accidental discovery of an excess of 2.5-inch yellow hay blades would be impossible unless someone told us beforehand that 2.5-inch yellow straw was important, in which case we would not have thrown it away.
In many ways, this tension between the desire to record everything on the one hand, and the need to be practical on the other, is nothing new. It is a feature of any experiment, from the lone scientist writing data in her lab notebook, to the international team of thousands using supercomputers. But this tension is amplified to unprecedented levels by big-data experiments, like the ones being conducted at the LHC. It is harder to “look without theory” in these experiments—to be randomly introduced to brand-new science. That might be OK if your theories are very wrong, so that your experiments turn up empty and you are forced back to the drawing board. But what if your theories are only slightly wrong—as many theories are? We look under the lamppost because that is where the light is, and we keep our eyes open to discover anything new—but what might be hidden in the shadows?
Michael Tuts has been a professor of physics at Columbia University since 1983. He is an experimental elementary particle physicist studying the fundamental forces and particles. Currently he is the Operations Program Manager for the U.S. contingent of the ATLAS experiment at the Large Hadron Collider at CERN, overseeing the support for about 500 physicists.