Anyone who’s ever seen a weather report, a stock market prediction, or a “flattening-the-curve” COVID-19 graph, has seen a mathematical model in action. Mathematical models can, for example, describe how cold fronts move, analyze fluctuations in stock prices, and predict changes in disease transmission within a population. At some point, often without realizing it, almost everyone has used such a model.
“Even when you just need to figure out where to stop and get gas during a long road trip, you end up using a mathematical model,” says mathematician Ami Radunskaya, PhD, of Pomona College. The model in that case is simple: you multiply the gallons of gas your car holds by your car’s fuel efficiency to determine how far a full tank will take you.
Mathematical modeling consists of breaking a problem down to its quantifiable parts and representing those parts in equations. In the situation above, for example, an equation would be g x e = m, with “g” equaling the number of gallons your tank holds, “e” equaling your car’s fuel efficiency (in miles per gallon), and “m” equaling the number of miles you can drive on one tank. When the data that’s plugged into an equation changes, the result changes. Most models are far more complex, but the basic idea of all mathematical models is the same—to develop a system of equations that deliver a result that can be applied in the real world, where the solution can be tested to make sure that the model works (did you actually have enough gas to get to your destination, for example).
“When you use the tools of mathematics to look at scientific problems, what you’re really doing is this beautiful iterative act of stripping things down to their most fundamental logic,” says Nina Fefferman, PhD, an evolutionary biologist at the University of Tennessee and the director of the National Institute for Mathematical and Biological Synthesis.
“Even when you just need to figure out where to stop and get gas during a long road trip, you end up using a mathematical model,” says mathematician Ami Radunskaya, PhD, of Pomona College.
Mathematical models have been invaluable in battling COVID-19. They’ve been used to help set the length of quarantines and school closures, to anticipate shortages of PPE and ventilators, and to develop vaccines. The models used for each of these problems were ready for action in 2020 thanks to many years of basic research.
Enormously useful mathematical tools that have been put to work during the pandemic—from classical differential equations to more recent techniques such as Monte Carlo methods and Markov chains—were in many cases invented by mathematicians who had no particular goal in mind. But the fact that these mathematicians were able to spend hours toying with and developing new models ultimately gave humanity a distinct advantage when we faced COVID-19.
Early Models to Combat Infectious Diseases
The first mathematical models debuted in the early 18th century, in the then-new field of epidemiology, which involves analyzing causes and patterns of disease. One of the earliest such models was developed in response to smallpox, an extremely contagious and deadly disease that plagued humans for millennia (but that, thanks to a global vaccination campaign, was declared to be officially eradicated in 1980).
During the early 1700s, European doctors learned about variolation, a way to prevent smallpox by giving people a mild case of the disease. The technique, widespread in the Asia, involved removing pus from a fresh smallpox lesion and transferring it to a healthy person to induce immunity. But variolation was risky, in that a small percentage of people experienced a more severe case of smallpox than expected and died, so English doctors were wary of the technique. They wanted to figure out if the benefit of variolation outweighed its risk before embarking on a large-scale inoculation campaign.
Swiss polymath Daniel Bernoulli, MD, created the first epidemiological model by using mathematics to analyze death data. First, he figured out what the benefit to the general population would be if variolation resulted in complete immunity from smallpox and involved no risk. He calculated that universal inoculation would, under those conditions, increase average life expectancy by almost 12% (by a little over three years, from about 26 years and 7 months to about 29 years and 9 months). To convince variolation skeptics that the benefit of so-called “artificial smallpox” outweighed its risk Bernoulli ran the calculation again, this time assuming that one out of every 200 variolated people would die. Under those conditions, the gain in life expectancy decreased only by about two months, which meant people would still live, on average, about 7.5% longer.
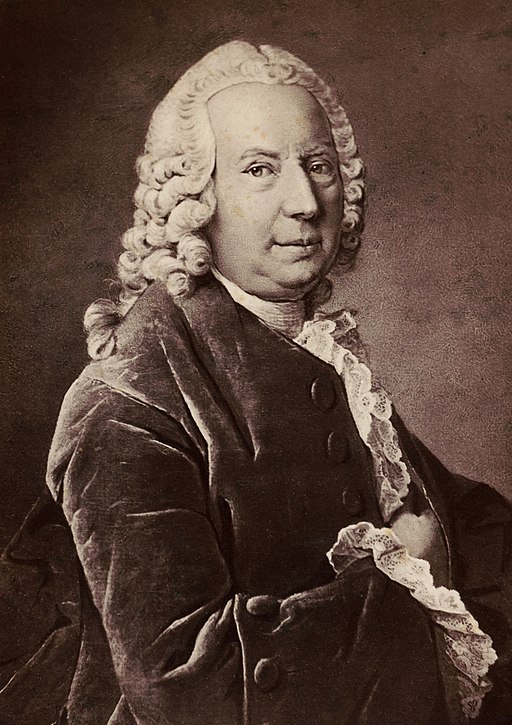
Worries similar to those of variolation skeptics still exist today among modern anti-vaccination activists, meaning that Bernoulli’s work remains relevant 300 years later. In fact, it’s almost as if Bernoulli anticipated modern-day anti-vaxxers when he wrote, “I hope that I shall not irritate those who declare themselves against inoculation.” That mindset makes it more important than ever to help the public understand the science and math that lie behind current efforts to combat infectious diseases.
Predicting the Spread of an Epidemic
In order to interrupt an outbreak, epidemiologists model the dynamics of the disease’s spread. In Bernoulli’s time, doctors and scientists thought illness spread through what they called “miasma,” or bad vapors in the air. Before the field of epidemiology could truly advance, scientists needed to figure out that disease-causing pathogens can be passed (via air, water, or some other means) from infected people to healthy people, who in turn become sick and spread the infection further. Once there was wide acceptance of the germ theory of disease, by late 1800s to early 1900s, physicians were able to develop the first so-called “compartmental” model of epidemiology. That model, which is still used today, helps scientists analyze how epidemics change by splitting a population into “Susceptible,” “Infected,” and “Recovered” cohorts, or compartments. Known as the SIR model, it’s used by scientists to predict changes in the three compartments as an illness sweeps through a population.
The logic of the SIR model makes it clear how variolation interrupted the spread of smallpox. Susceptible people who were inoculated—and who quarantined themselves while recovering from their mild, induced cases of smallpox—could then be moved directly into the Recovered compartment, before they had a chance to infect others. Vaccination and other modern preventative measures, such as masking and handwashing, work similarly, by interrupting an infection’s spread.
But researchers must be careful about the assumptions they make when creating and selecting a mathematical model. “Any model you build is only going to be good for answering the questions you asked,” says Christina Edholm, PhD, of Scripps College, who works with SEAIR models, in which Exposed and Asymptomatic compartments are added to the SIR model. “It's not going to answer other questions, which involve making different assumptions.”

Despite the fact that they date back hundreds of years, compartmental models like SIR and SEAIR are still the bread and butter of modern epidemiology. Only in the last two decades, with the advent of supercomputers, have researchers started using an alternative to compartmental models. Called “agent-based models,” this new approach requires massive computing power because it mimics a random and individual model, as well as huge amounts of data to simulate individual behavior. For instance, if an agent-based model was used to assess the likely spread of COVID-19 in grocery stores, one data point would be that an individual who always shops on Tuesdays could infect the Tuesday cashier, but not the Wednesday cashier. Both types of models are still in use today, and both can be credited with helping scientists untangle the basic logic of how diseases spread.
A Matter of Differentials
To get predictive numbers out of such models, mathematicians develop what are known as differential equations, which use calculus to describe how various quantifiable factors change relative to each other. Since the 1670s, when mathematicians (including Bernoulli’s father) developed the principles of calculus, researchers have used differential equations to manipulate, optimize, and solve mathematical questions that model real-world scenarios. For instance, they can figure out how quickly an epidemic will slow down relative to the number of people who are vaccinated.
But differential equations by themselves are not enough to model epidemics—it’s also necessary to take into account the fact that human behavior has some randomness to it. For instance, if that Tuesday shopper forgot something on their list, they might stop back in at the grocery store on Wednesday. Differential equations don’t factor in that sort of random event, which is where what’s known as “probability theory” steps in. Probability theory studies the likelihood of events, which are represented as so-called “random processes.”
“Ordinary differential equations are wonderful for analysis, but if you start with one infected person, an ordinary differential equation will always simulate the same outbreak,” Edholm explains. “The key is you formulate models with random processes that capture the same dynamics of ordinary differential equations.”
Probability theory started taking off around the 1650s, motivated by gambling questions. In 1713, Jacob Bernoulli (Daniel Bernoulli’s uncle) discovered one of the fundamental building blocks of probability. He was the first person to prove what is known as the “law of large numbers,” which holds that the more times someone performs a given action (let’s call it “X”), the closer the average value of X gets to what one would expect it to be. Take the annual flu shot as an example. Suppose a given year’s shot is 60% effective (the annual flu shot has a lower effectiveness than many other vaccinations because the influenza virus mutates at an especially high rate), meaning 40% of vaccinated people would still get the flu. By chance, 10 neighbors might all get the flu, even though they were all vaccinated. But in a city of 100,000 people who were all vaccinated, the law says that the number of cases would probably be right around 40%, or 40,000, because the greater the number of flu shots given, the closer the number of cases would be to the expected percentage.
Mathematical Insights From Poetry
During a pandemic, epidemiologists also need to figure out the probability of, for example, hospital beds getting filled, the disease spreading to new regions, and caregivers running out of personal protective equipment (PPE). To do so nowadays, they run their models through high-powered computers.
But computers can’t guide themselves.... A computer doesn’t understand real-world circumstances and limitations unless it’s given them.
One of the most important contributions to this kind of modeling dates from the early 1900s, when a Russian mathematician named Andrey Markov analyzed the first 20,000 letters of a popular poem by Pushkin. He proved that letter probabilities aren’t independent; for example, four consonants don’t usually show up in a row in English. So whether or not the previous letter in a string of text is a consonant affects the probability that the next letter will be a vowel. Based on that exercise, Markov developed the idea of a variable whose state depends only on its previous state—a technique now known as a Markov chain.
Today, Markov chains are used in fields ranging from physics and chemistry to computer science and baseball. For an epidemiologist, a Markov chain might represent an individual who is either Susceptible, Infected, or Recovered; the person’s chance of recovering doesn’t rely on their chance of being infected, only on whether they are currently infected or not. Edholm’s most recent paper includes 10,000 computer-generated iterations of solutions to her team’s Markov chain equations.
But computers can’t guide themselves. If public health officials are trying to figure out how much PPE New York City needs, for example, they wouldn’t plug just 1,000 nurses into their equation, because they know New York has many, many times more nurses than that. A computer doesn’t understand real-world circumstances and limitations unless it’s given them. When we tell a computer to conduct an analysis based on a certain number of nurses, we’re narrowing what’s known as its “parameter space.”
Epidemiologists narrow down parameter spaces using a technique called Monte Carlo methods, developed in 1946 by mathematicians at the Los Alamos Laboratory in New Mexico. The idea behind Monte Carlo methods, which are named for the European gambling mecca, arose when a convalescing mathematician named Stan Ulam wondered what the average chance of winning at solitaire is. Instead of applying abstract mathematical tools, Ulam concluded, according to an interview he gave some years later, that it might be more efficient, “to lay [a game] out say one hundred times and simply observe and count the number of successful plays.” The era of fast computers was in its infancy then, and Ulam realized that his solitaire solution might be transferrable to running numerous iterations of complex mathematical operations—“problems of neutron diffusion and other questions of mathematical physics”—through a computer.
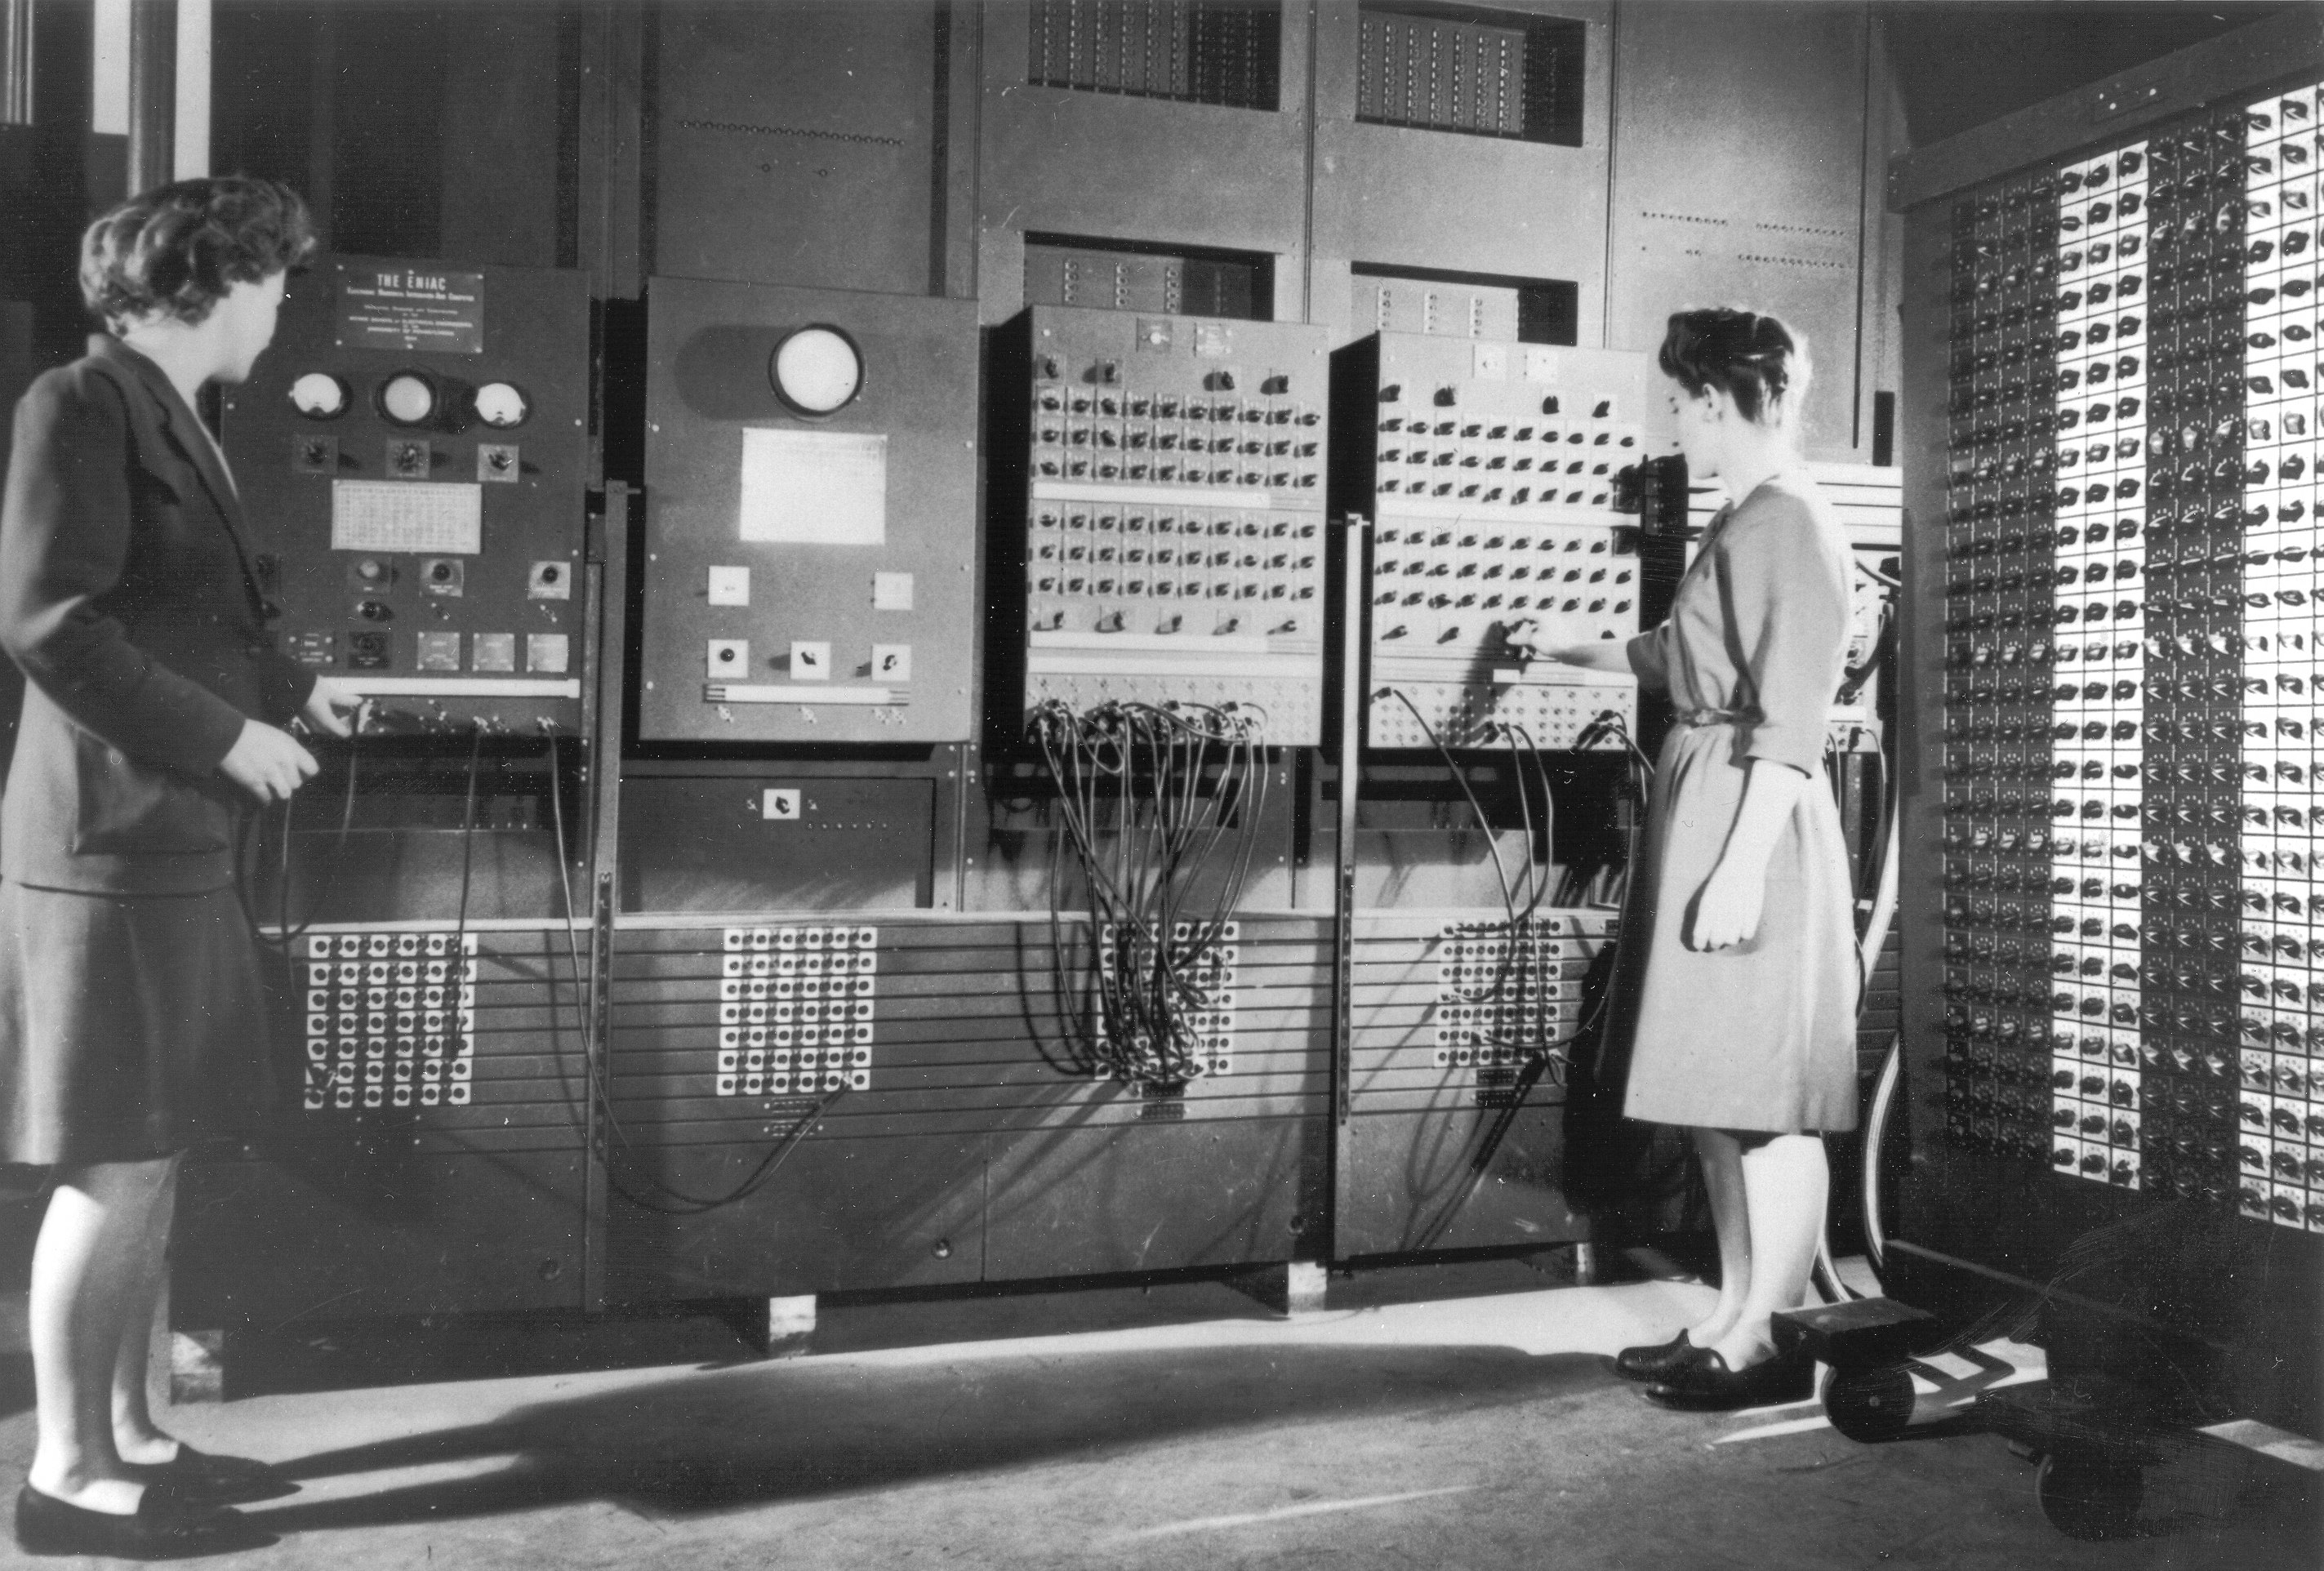
With an access to an electronic, programmable computer (ENIAC), Ulam and other mathematicians started applying Monte Carlo methods while developing the hydrogen bomb. From such destructive beginnings, Monte Carlo methods have evolved to find applications in physics, chemistry, computer science, and many other fields. “These Monte Carlo methods are ways of keeping you in the parts of parameter space that are more likely to be fruitful and not letting you just run off into values that are going to waste a lot of computer time and not be meaningful,” says epidemiologist Marc Lipsitch, PhD, the director of Harvard’s Center for Communicable Disease Dynamics.
Today, epidemiologists use a fusion of these two techniques—known as the Markov Chain Monte Carlo method—to analyze epidemics: a far cry from the techniques’ origins in poetry and solitaire. These tools came about because mathematicians had the time to toy with new ideas that only later revealed their usefulness.
Calculating Basic Reproduction Number
A key statistic used by epidemiologists is “basic reproduction number,” which is represented as R₀ (pronounced “R-naught”). R₀ is the number of new infections expected to arise from each case of a disease. If a disease’s R₀ is less than 1, a smaller and smaller number of new infections will arise. And once the already-infected people have recovered (or died), the epidemic too will eventually die out. But if a disease’s R₀ is greater than 1—say 10, or 20, with each infected person spreading the disease to 10 or 20 other people—then the disease creates an outbreak.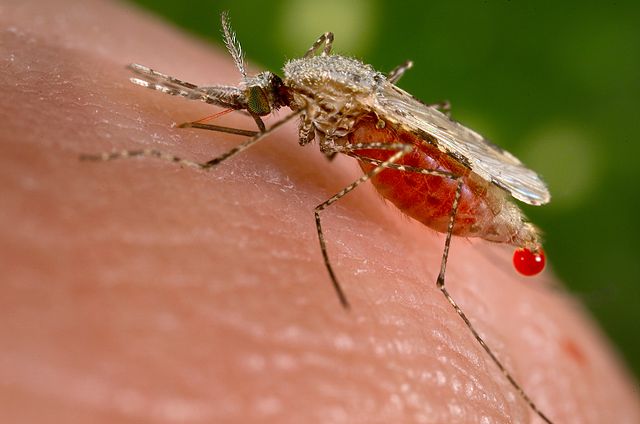
The use of R-naught in epidemiology arose from efforts to combat malaria. In 1902, a British doctor named Sir Ronald Ross won the Nobel Prize in Physiology or Medicine for discovering that malaria is transmitted by mosquitoes. Health officials worried that it would be necessary to kill all mosquitoes to eradicate the disease. But Ross proved that reducing the number of mosquitoes below a critical level was sufficient, and in doing so incorporated the concept of R-naught in epidemiological work. Calculating a disease’s R₀ can get very complex, but at its most basic level it calls for two numbers: how many people one individual is expected to infect in a day, also known as the transmission rate, and how many days an individual remains infectious. Multiplying those two numbers results in R₀—the number of people one individual is likely to infect.
“That calculation allows us to estimate if we’re in the upswing of an outbreak, and it gives us insight into where we can interrupt: we can either cause people to recover faster or we can take away opportunities for new infection,” Fefferman says. “When we do that, we’re decreasing the reproduction number and we can slow or stop an epidemic.”
A related concept, “effective R₀,” includes factors that change the size of a given compartment. For example, the number of people in the Susceptible compartment might be changed by migrations, births, or deaths. Or social distancing might reduce the number of close contacts an infectious individual has, thus reducing the size of the Infected compartment. Such factors affect a disease’s effective R₀ without affecting its “pure R₀.”
In a sense, mathematical modeling has a life cycle: researchers propose a pure mathematical model; epidemiologists plug real-world data on an outbreak into the model; policy-makers listen to epidemiologists and propose mitigation measures; then the results of those measures are fed back into the model.
In a theoretical SIR model, all epidemics eventually die out because the Susceptible compartment empties. But with enough births, an outbreak can continue. For instance, before the availability of an effective vaccine against measles, deadly measles outbreaks occurred regularly in Europe, but at curiously different rates from one country to another. Eventually, health officials figured out that those cycles were tied to birth rates: New babies were especially susceptible to measles, so if a country’s birth rate increased, so did the incidence of measles.
“Without the mathematical perspective, we would never have looked at ‘Why are there outbreaks every X years in Germany and every Y years in Belgium and every Z years in France?’” Fefferman explains. “The answer was by understanding exactly this idea of effective R₀.”
For most diseases, pure R₀ can be calculated using historical data, but with each new outbreak epidemiologists must figure out a new effective R₀. “R₀ tells a story about transmission pathways,” says Edholm. “How do people get infected and how do people get recovered? And how do you move through these infections and how do they propagate?”
Getting People to Listen to the Models
After epidemiologists understand the patterns of a particular outbreak, they can propose solutions to stymie an outbreak and keep it from turning into an epidemic (a disease that arises, affects a large number of people, then subsides) or a pandemic (a widespread epidemic, affecting several continents or the whole world). And for that to happen, the solutions need to be enacted and promoted by policy-makers.
But Fefferman notes it’s necessary to keep in mind that “math models are meant to be self-defeating models in epidemiology: they’re meant to help people make them wrong. In an ideal world, every epidemiological prediction of an outbreak would end up failing,” because policy solutions would halt the outbreak. For instance, a model might assume that a person has 20 social contacts a day. But if policy-makers enact social distancing measures, then the model’s assumptions—and thus conclusions—are rendered incorrect. Models thus need to be “a living tool,” Fefferman says. Epidemiologists need to propose solutions to decision-makers, then update their models with the impacts of those solutions.
In a sense, mathematical modeling has a life cycle: researchers propose a pure mathematical model; epidemiologists plug real-world data on an outbreak into the model; policy-makers listen to epidemiologists and propose mitigation measures; then the results of those measures are fed back into the model. The mathematicians doing basic research today—possibly inspired by poetry or card games and certainly funded by a mix of government grants and private philanthropy—are now laying the foundation for fighting future outbreaks.
“If we don’t have that research on hand, then when something like a pandemic comes up, we don’t have the tools to get on top of it right away,” Radunskaya says.