If you watch the banks of a river long enough, you’ll see geological change happening in real time. A small crumble of soil might slide into the current, or a pebble, as the earth around the river is taken in by the flow of the water. Try to wade across even ankle-deep water when it is moving, and you can feel why. Rivers and streams are strong. But humans tend to have a poor sense of scale when it comes to how Earth’s features shift. So when a river is placed on a map, it seems like it ought to stay there. Like a county road.
Rivers, of course, do no such thing.
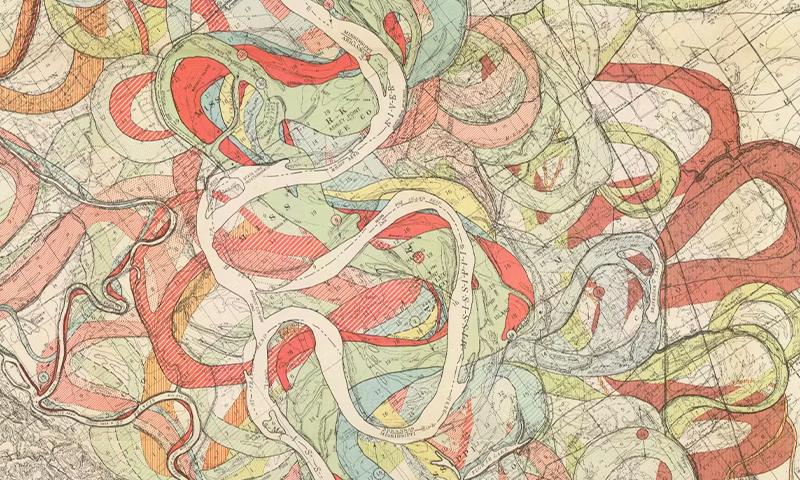
Over time, they are wild and wayward things, reshaping the landscape. This vitality is captured by a series of mid-century maps, including the one shown here. Created in 1944 by geologist and cartographer Harold Fisk and titled “Ancient courses within the Mississippi River meander belt,” the series charts the many paths of the Mississippi River over thousands of years, as it has made its way from what is now Illinois to current-day Louisiana.
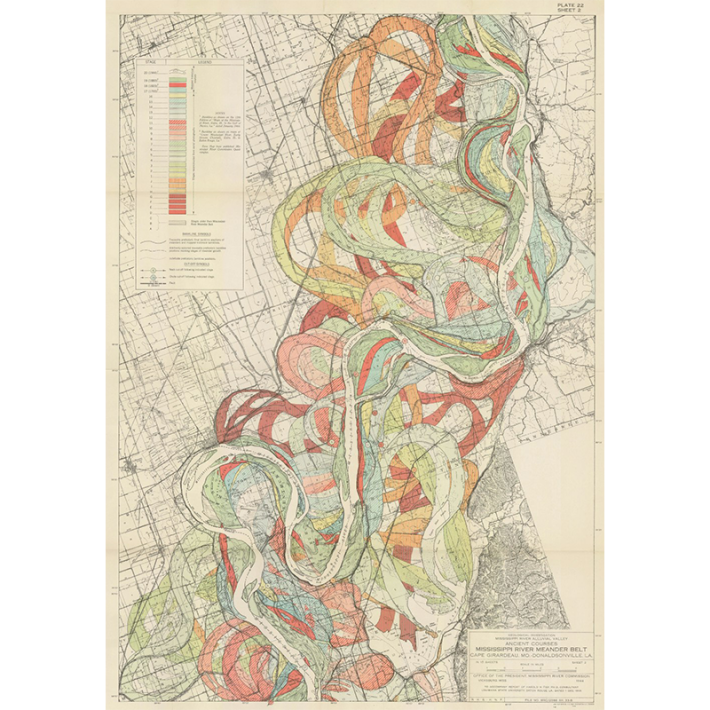
In Fisk’s report for the United States Army Corps of Engineers, the river’s 1944 path is white, with other courses shaded differently: solid pink for its route as mapped in 1820, solid blue in 1765. More ancient flows were projected based on aerial observations, colored in a dotted or striped rainbow of layers. The river’s looping, loping path through the years expands the mind to the dynamism of deep time.
Beyond aesthetic fascination or geomorphological curiosity, though, these maps also highlight a serious problem. Rivers are natural places around which to build trading outposts, and then towns, and then cities and suburbs. Researchers estimate that in the U.S. as of 2018, some 41 million people were living in river flood zones—a number far higher than many still-outdated FEMA floodplain maps would suggest.
And when rivers do what rivers like to do—meander—they care not for what might be in their path next, be it a pebble or a town. 
Lead image: courtesy of the US Army Corps of Engineers