Remember domino theory? One country going Communist was supposed to topple the next, and then the next, and the next. The metaphor drove much of United States foreign policy in the middle of the 20th century. But it had the wrong name. From a physical point of view, it should have been called the “sandpile theory.”
Real-world political phase transitions tend to happen not in neat sequences, but in sudden coordinated fits, like the Arab Spring, or the collapse of the Eastern Bloc. These reflect quiet periods punctuated by crises—like a sandpile. You can add grains of sand to the top of a sandpile for a while, to no apparent effect. Then, all at once, an avalanche sweeps sand down from the top in an irregular pattern, possibly setting off little sub-avalanches as it goes.
This analogy doesn’t necessarily get us anywhere. After all, real sand is hard to analyze, just like real politics. But here’s the miracle. A kind of abstraction of a sandheap, known as the “abelian sandpile model,” created by physicists Per Bak, Chao Tang, and Kurt Wiesenfeld in 1987, seems to capture some of the rich, chaotic features of real sandpiles, not to mention other complex systems from biology, physics, and social science—while remaining simple enough to study mathematically.1
It works like this. Imagine an infinite grid of dots, and on each dot, a tiny pile of sand. We can keep track of how many grains of sand there are on each dot by writing a number there.
But a vertical pile of sand grains can only get so high. Let’s say that, whenever four or more grains of sand are at the same dot, four grains topple off, one in each compass direction. So if you start with this:

The pile at the left topples and gives you:
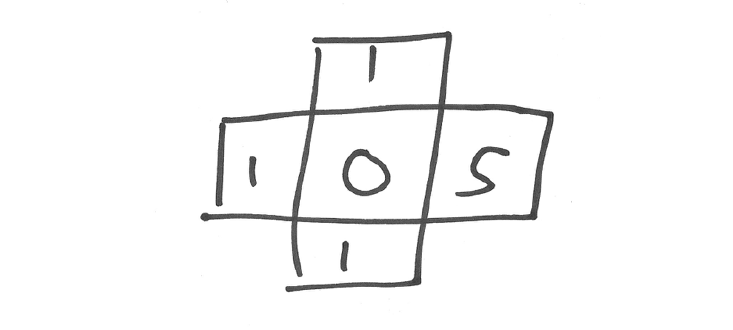
After which the pile on the right, which is overloaded too, drops 4 grains on its neighbors:
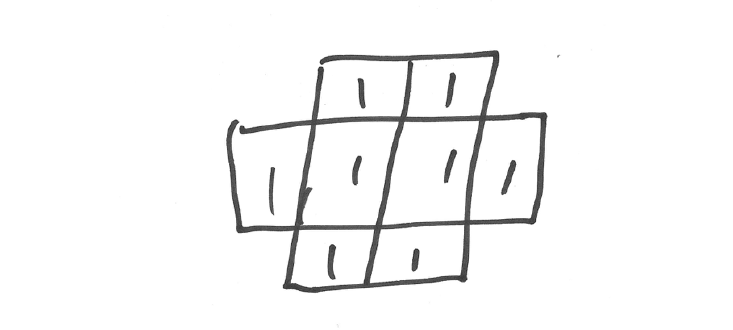
At which point the sandpile is stable; no location has more than four grains, and the process stops.
How did I know which pile to topple first? Good news: It doesn’t matter. As the symmetry of the final configuration suggests, the end state of the abelian sandpile doesn’t depend on the order in which you carry out the topples. That’s what makes it “abelian,” which is mathese for “doing this, then that, is the same thing as doing that, then this.” Addition is abelian: Adding 2, then adding 3 is the same as adding 3, then adding 2. Most operations aren’t abelian. Unlock your car and pull the door handle, and the door opens; pull the door first and then unlock the car, and you get a different result: closed door, unlocked car. So the abelian nature of the sandpile is a pleasant surprise.
What happens if you pile a lot of sand—say, a million grains—on one dot, and let the sand flow until the toppling settles down to stability? You might imagine you’d end up with a big smooth pile of sand, with a big area near the center of dots maxed out with three grains of sand.
You’d imagine wrong. Here’s what you get:
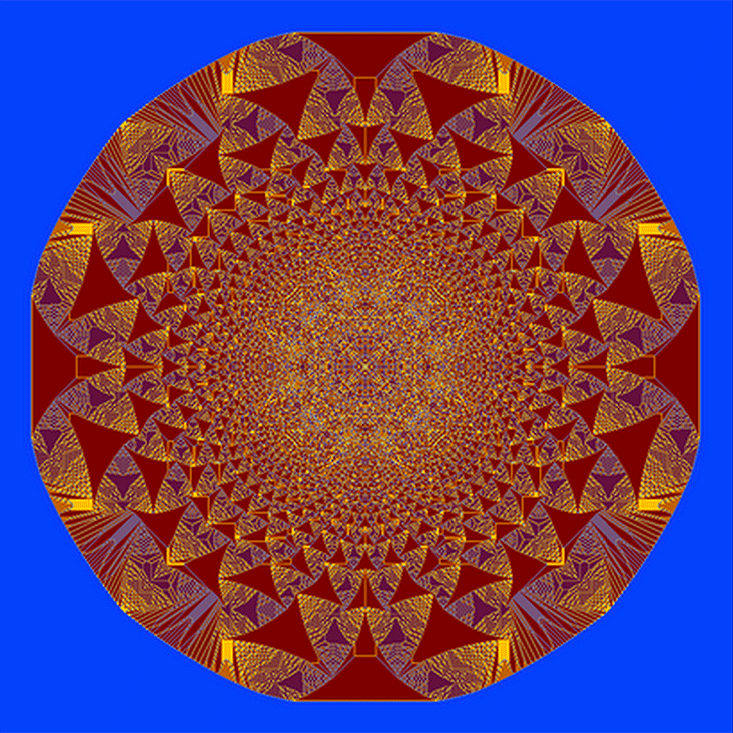
Well, maybe a million wasn’t enough to settle down to something smooth: what if you start with a billion instead? You get this:
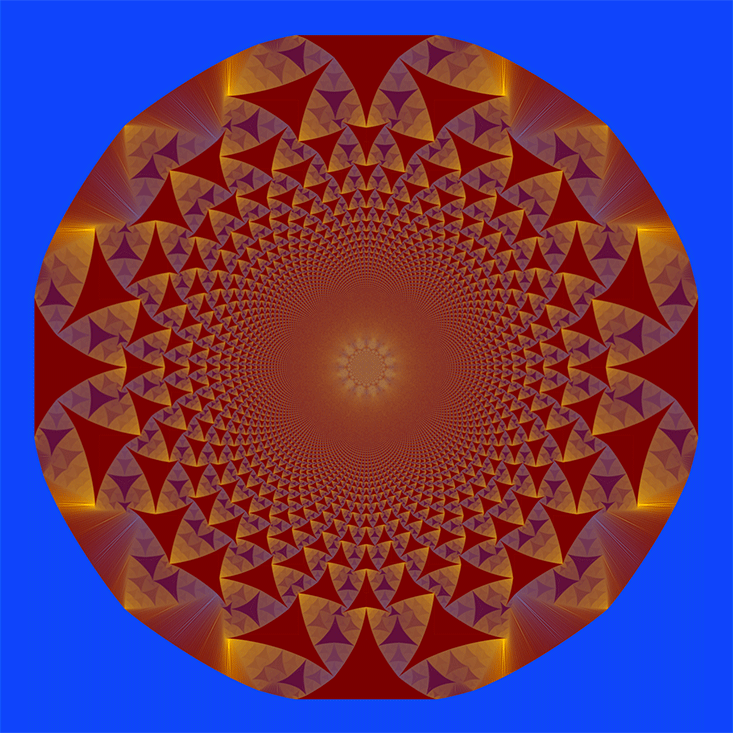
The hoped-for smoothing isn’t happening. Instead, these crazy fractal patterns persist. Near the center, an intricate pattern, like the inside of a dome inlaid with latticework that somehow looks geometric and random at once; and near the edge of the heap, triangular islands of more consistent behavior, interlocking in regular patterns.
And that’s just the structure you can see. These images were generated by Wes Pegden, a math professor at Carnegie Mellon whose work with Lionel Levine and Charlie Smart (not a swaggery math pseudonym, his real name!) of Cornell stands at the leading edge of sandpile studies.2 Pegden has interactive pictures of the billion-grain sandpiles on his website. There, you can zoom in and wander to your heart’s content. You can head straight for the symmetric loveliness of the center of the pile:
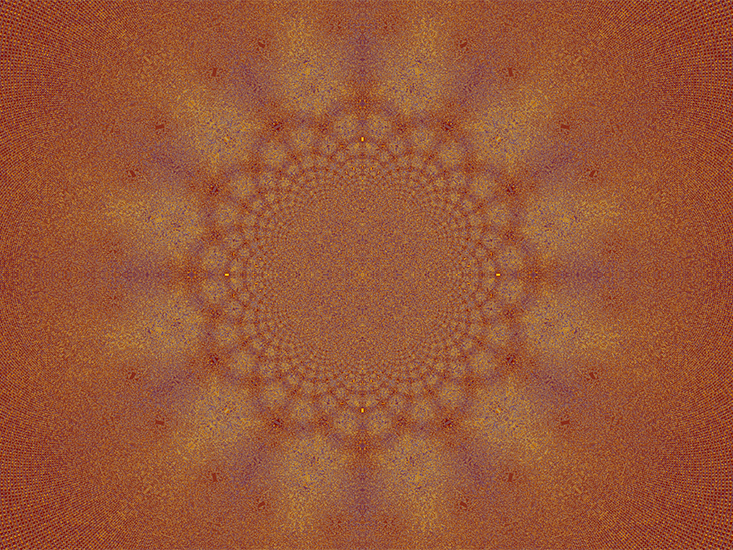
or focus on the spiky weirdness of the outer rim:
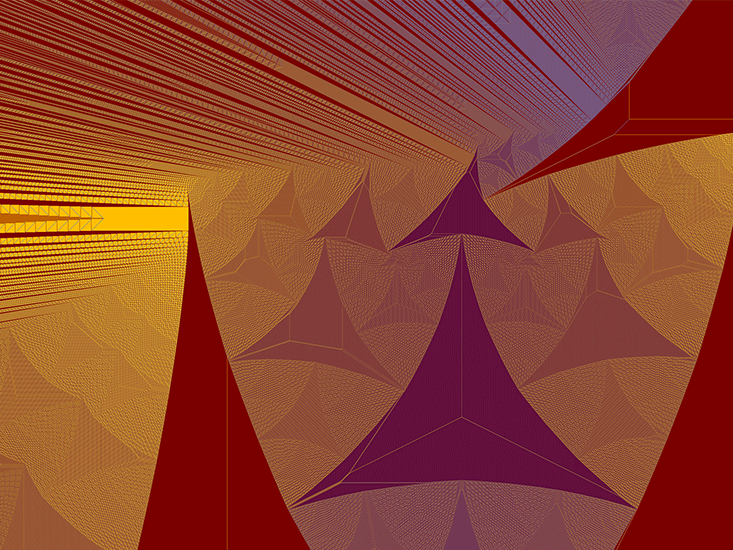
There’s even finer local structure, too. Every math article should have a homework assignment, and here’s today’s: Check that two adjacent dots in the interior sandpile can never be empty at once (see Solution for the answer). In fact, experiments I’ve run suggest that something even stronger might be true: Empty dots not only can’t be next to each other, they tend to not even come near each other, repelling one another like particles of the same charge.
Before you go out looking at sand dunes with a microscope, I should warn you that real piles of sand don’t generate this kind of spontaneous structure.3 The abelian sandpile model doesn’t even try to capture the behavior of actual physical materials. Rather, all of its complexity emerges from an abstraction, a simple deterministic algorithm you can describe in five lines of code. It’s reminiscent of John Conway’s “Game of Life,” which also produces rich complexity from a very simple ruleset. The abelian sandpile, like the Game of Life, is a cellular automaton: that is, a mini-universe whose condition can be completely described in the kind of discrete language computers find agreeable. In the sandpile, each dot on the grid gets a number between 0 and 4, and a simple set of rules set the values of adjacent dots. In the Game of Life, the state is even simpler: Each dot is either “alive” or “dead,” 1 or 0.
But there’s a difference. The Game of Life can be coaxed into complex behavior, but it tends to take a little work.4 In this respect, it’s typical among cellular automata. The sandpile, on the other hand, seems to direct itself automatically toward complex behavior, without any special effort to set up just the right initial conditions.
It does this by seeking out a so-called critical threshold, around which complex behavior tends to be found. You’re familiar with the idea of thresholds from nature. Water at a high temperature is a disorganized liquid; when the temperature crosses a certain critical value, the water undergoes a sharp transition, crystallizing into ice. For the sandpile, the analogue of temperature is density: How much sand is there per dot? Too much sand and the pile is unstable, essentially one long avalanche. Too little, and the sand quickly settles into a stable state. How much is too much? The answer is unexpectedly simple: An average of exactly 2.125 grains per dot is the critical threshold, the dividing line between quiet and chaos.
Remarkably, a sandpile on a finite table—where any sand reaching the rim falls off the edge and disappears—tunes itself to 2.125 grains per dot. Say the table starts empty, and you drop sand, grain by grain, in the center. For a while, the pattern of sand expands, looking a lot like Pegden’s pictures above (which depict an infinite table.) You drop a grain, the sand settles, there’s one more grain on the table. But once the sand gets to the rim, the story changes. The pile approaches an equilibrium, where sand drops off the edge at the same rate you add sand to the center, and the density holds steady at the critical value. Of course, there may be local fluctuations, denser and less dense patches that come and go as the system evolves; but on average over the whole table, the number of grains per dot will hover around 2.125.
What if you start with a finite table as dense with sand as possible, three grains at each spot? That configuration is stable. But only in a very fragile sense. Drop one grain, anywhere on the table, and a massive avalanche begins, not ceasing until the density goes down to 2.125 again.
And what happens once the table reaches threshold density? Then the sandpile is poised at its most interesting state. Avalanches keep happening, but they don’t create a state of constant universal tumble; rather, they come in waves, with frequent smaller avalanches punctuated by rare table-spanning catastrophes. The distribution of avalanches at threshold density seems to obey a power law: The frequency of avalanches is inversely proportional to their size. There’s constant activity, but the activity is somehow organized and structured. What’s more, the sandpile doesn’t have to be fine-tuned in order to show off its complex behavior; it autotunes. This is the phenomenon called “self-organized criticality.” Wherever the system starts, it finds its way to the critical threshold, and stays there, as long as new sand keeps getting added at a constant rate.
Pictures aren’t enough: You have to see this happen. R.M. Dimeo of the National Institute of Standards and Technology made a series of hypnotic movies of the sandpile at its critical state.
This looks like a living process to me. And that’s no coincidence. The notion of self-organized criticality is one popular way to think about how the rich structures of life might have emerged from simple systems that automatically seek the critical threshold. Some biologists see self-organized criticality as a potential unified theory for complex biological behavior, which governs the way a flock of birds moves in sync just as genetic information governs the development of the individual birds.5 “Living systems,” wrote biological theorist Stuart Kauffman, “exist in the solid regime near the edge of chaos, and natural selection achieves and sustains such a poised state.” As does the sandpile. It isn’t life, of course, not really. But it’s lively, isn’t it?
The sandpile, by virtue of being first, is the most-studied example of self-organized criticality; but there are many others (some of which are depicted elsewhere in Pegden’s gallery). We don’t really know what it is about the rules of the sandpile that makes the system evolve inevitably towards its complex, critical state, and we don’t have a clear understanding of which cellular automata are likely to exhibit self-organized criticality.
Insight may come from the surprising connections of the sandpile with other parts of mathematics. To a geometer, like me, the sandpile has to do with the emerging field of tropical geometry, which aims to model continuous geometric phenomena by analogous discrete ones. To a probabilist, the sandpile is intimately related with something called a spanning tree, which (on a square grid) is a branching path that touches every point on the grid but never forms a closed circuit. Wherever insights come from, the sandpile reminds us that the really interesting phenomena in math, like the really interesting phenomena in physics, often happen at the phase transitions. It’s there that we are poised between two different regions of mathematics, sharing features of both, passing information across the boundary. And questions, too. Always more questions than answers.
Jordan Ellenberg is the John D. MacArthur Professor of Mathematics at the University of Wisconsin-Madison. He is the author, most recently, of Shape: The Hidden Geometry of Information, Biology, Strategy, Democracy, and Everything Else.
References
1. Bak, P., Tang, C., & Wiesenfeld, K. Self-organized criticality: An explanation of the 1/f noise. Physical Review Letters 59, 381-384 (1987).
2. Levine, L., Pegden, W., & Smart, C.K. Apollonian structure in the Abelian sandpile. preprint arXiv.:1208.4839 (2014).
3. Mehta, A. & Barker, G.C. Disorder, memory and avalanches in sandpiles. Europhysics Letters 27, 501-506 (1994).
4. Aron, J. First replicating creature spawned in life simulator. New Scientist 2765, 6-7 (2010).
5. Mora, T. & Bialek, W. Are biological systems at criticality? Journal of Statistical Physics 144, 268-302 (2011).
This article first appeared in our “Dominoes” issue in April 2015.


