


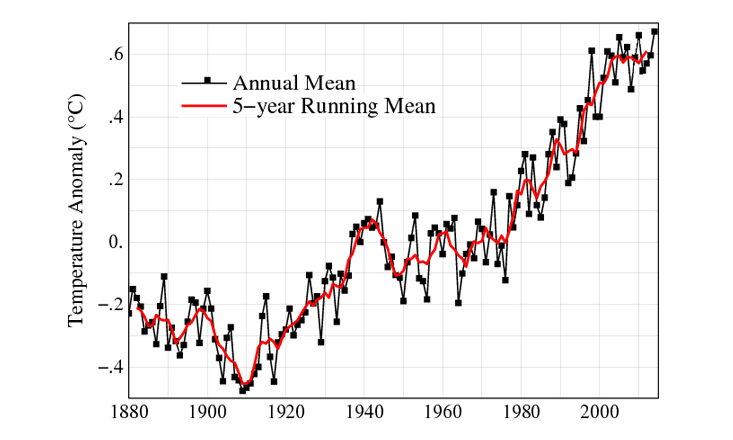
Nothing has caused climate scientists quite as much recent trouble as the so-called “global warming hiatus.” Not only did this approximately 14-year lull in the rise of global mean (or average) temperatures provide fodder for a variety of misguided climate change deniers (there have been other, longer pauses), but it also represented a genuine scientific mystery. Scientists knew it was being caused by falling ocean temperatures, but they also knew that the ocean, as a whole, was warming. Where was the extra heat being stored, and when would it make itself known?
Then this past November Axel Timmermann, a climate scientist at the University of Hawaii’s International Pacific Research Center, announced that global mean temperatures had finally resumed their rise, driven mainly by an unprecedented spike in sea surface temperatures in the northeast Pacific.
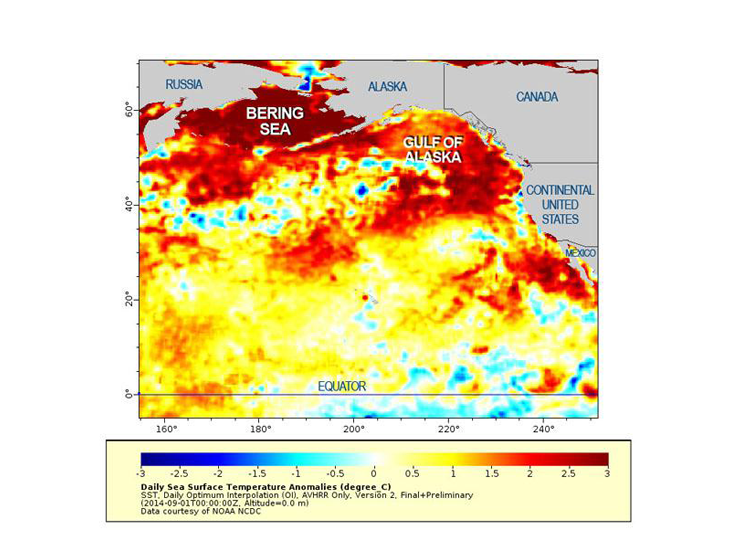
This unexpected shot of heat showed up in late 2013 as a discrete orange blob in satellite imagery, and by the end of last summer, sea surface temperatures as far north as the Gulf of Alaska were the highest ever recorded. So too was the global mean temperature for 2014. While it will take more time to see if the record represents the beginning of a renewed warming trend, Timmermann makes no bones about it—he believes that the blob has ended the hiatus.
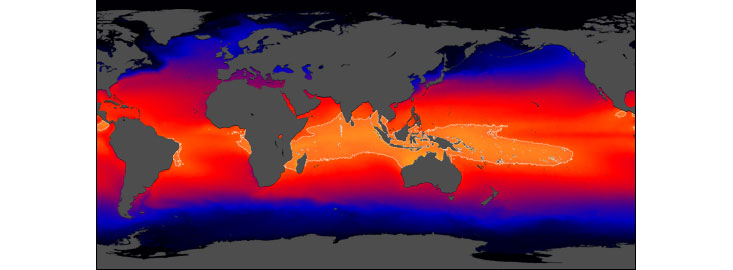
The story of the blob starts with an unlikely protagonist: a vast pool of warm water, thousands of kilometers wide and more than 100 meters deep, and thousands of miles away, stretching across the equatorial western Pacific. Although this warm pool was discovered decades ago, questions about its role in climate change remain unclear. How is it connected to last year’s temperature spike in the remote and frigid Gulf of Alaska? Was it primarily responsible for storing the planet’s excess heat during the hiatus? Why did the blob emerge when it did? As scientists piece together the answers to these questions, one lesson is emerging above all others: To understand climate change, we need to remember that the ocean has a very long memory.
Terrestrial (land-based) warming never really experienced a hiatus; it was only sea surface temperatures that stalled, and even those didn’t stall everywhere. Most of the hiatus was the result of falling sea surface temperatures in the central and eastern Pacific, caused by two decades of unusually strong equatorial trade winds.1 These winds pushed aside warm surface water, causing deeper and colder water to well up in its place, cool the atmosphere above, and reduce global temperature averages. The winds also pushed enormous quantities of warm water westward. This caused a “downwelling” in the western Pacific, as the mass of all this tropically heated water moved the boundary between the warm layer at the ocean’s surface and the cold layer beneath (called the thermocline) to a greater depth. So much warm water was pushed into the region that sea levels began to rise at nearly triple the global rate.2
Even though it’s thousands of miles away, climate scientists suspect this warm pool of playing a role in last year’s sudden temperature spike in the north Pacific, and the potential end of the hiatus. Tom Delworth, a research scientist in National Oceanic and Atmospheric Association’s (NOAA) Geophysical Fluid Dynamics Laboratory has built a model that suggests the deep water of the warm pool made its way north and produced the blob. “It doesn’t just stay there,” he says. “It actually begins to spread, particularly into the north Pacific. In our simulations, that warm water re-emerges in the north Pacific after 10 or 20 years.” Even if the unusually strong equatorial trade winds were to continue, Delworth says, the hiatus would not. The warm pool in the west Pacific “isn’t going to stay hidden forever. It comes back.”
To definitively answer how, exactly, this might have happened is a rather complicated question. The ocean covers nearly three-quarters of the earth’s surface and contains over 1.3 to 1.4 billion cubic kilometers of water. Keeping track of all that water is not easy. Historically, ocean temperatures were taken from the deck of a ship. Even today, most of what we know about deep ocean conditions comes from shipboard measurements. In recent decades, scientists have deployed thousands of buoys—both anchored and free-floating—and satellites capable of infrared and microwave imaging. These satellites can measure sea surface temperatures and heights, often down to the centimeter, allowing scientists to accurately delineate the boundaries of warm currents and eddies.
Total travel time? “Several years to decades,” Timmermann says, “depending on the details.”
The ocean’s surface, then, can be measured quite well. It is the ocean depths that are a problem. Infrared satellite imagery only indicates the temperature of the top few millimeters of the ocean. Microwave imagery is only slightly better. The deep ocean is mostly invisible to satellites, and our understanding of its three-dimensional movements is often provisional. What’s more, warm water can lurk for years, undetected, beneath the surface—especially in the higher latitudes. “A really interesting property of sea water,” Delworth says, “is that, at very cold temperatures—near the freezing point—the density of sea water is mainly determined by how much salt there is in it rather than how warm it is.” This means that, instead of a warm layer on the surface and a colder layer below, as is normally the case, at high latitudes you can have a layer of cold fresh water stably stratified over a warm layer of denser salty water.
While the story under the ocean’s surface can resist our measurements, we do know quite a bit about surface currents. The most obvious mechanism for moving water from the warm pool in the west Pacific to the colder northeast Pacific would be the great clockwise circulation of currents called the North Pacific Gyre. The strongest part of these oceanic circulations is always the western boundary. In the North Atlantic, we call this boundary current the Gulf Stream; in the North Pacific, it’s known as the Kuroshio Current. This powerful stream pumps warm, tropical water from near the Philippines northward to the coast of Japan. From there, it veers east, as the Kuroshio Extension, dissipating its heat into the cold north Pacific as it goes.
While it’s clear the Kuroshio Current had some role to play in the sudden spike of sea surface temperatures in the northeast Pacific and the Gulf of Alaska, it can’t be the whole answer. There’s no sign that it changed in intensity last year, or that it transported any more warm water than usual.
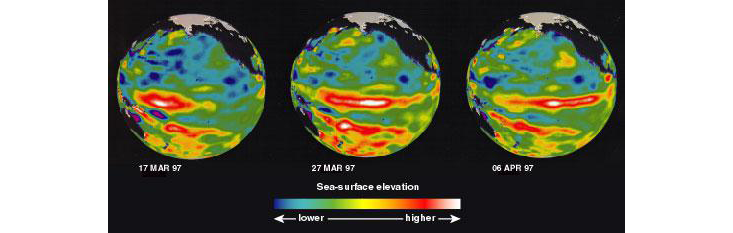
Another possibility lies in perhaps the least controversial mechanism for moving heat across great distances of ocean: Kelvin waves. These are not like the waves you see flopping up on the beach. They don’t propagate on the surface of the water at all; instead, they are oscillations of the thermocline, and are much slower than surface waves. At about six miles per hour—roughly jogging speed—it takes about two months for an equatorial Kelvin wave to cross the Pacific from the warm pool to South America. Despite their slow speeds, equatorial Kelvin waves can transport enormous amounts of warm water, and have wavelengths on the order of thousands of miles. El Nino—the great cyclical shift of warm water from the western to the eastern Pacific—can be understood as the effect of Kelvin waves. In satellite imagery, these waves are easily distinguished as a livid wedge of water moving slowly eastward along the equator.
The arrival of the blob into the Gulf of Alaska last year, and the potential end of the hiatus, was almost certainly related to a Kelvin wave. In 2014, a strong westerly wind burst in the equatorial Pacific pushed down the local thermocline. “This is like when we throw a stone into a pond: It has ripple effects,” says Timmerman. Those ripple effects took the form of Kelvin waves, which moved along the equator until they reached the coast of South America, and then propagated slowly north and south along the coastline. The north-flowing coastal Kelvin wave was so pronounced and so warm that many climate scientists, including Timmermann, thought it finally meant the onset of an El Nino event, perhaps easing the four-year drought in California. This expectation was heightened by El Nino-like declines in the Peruvian fishery, and reported encounters with exotic tropical fish as far north as Canada.
But the big El Nino didn’t materialize. In part, that’s because of their extremely slow speed. Coastal Kelvin waves are even slower than equatorial ones, and much of the heat of a northbound coastal Kelvin wave diffuses out to sea as it moves. By the time last year’s big Kelvin wave reached the Gulf of Alaska, Timmermann says, it probably didn’t carry enough heat to fully account for the record sea surface temperatures.
Whatever caused the warming in the north Pacific last year, it likely involved both the Kuroshio current and Kelvin waves, and perhaps other effects that haven’t been identified yet. But whatever they were, one thing is clear: Many of them are remarkably slow to act, making the warming event (and other climate phenomena) that much harder to unravel. Timmermann says this kind of lag time is the rule, not the exception, when it comes to climate (see Slow to Act).
Consider a modest, local event, like a change in the density of the Labrador Sea between Canada and Greenland. It might propagate as coastal Kelvin waves down the east coasts of North and South America, cross the Atlantic as an equatorial Kelvin wave, follow the coast of Africa around Cape Horn, cross the Indian ocean, again as an equatorial Kelvin wave, then pass through the Indonesian archipelago and into the equatorial Pacific. Total travel time?
“Several years to decades,” Timmermann says, “depending on the details.”
Those Kelvin waves will also produce another set of waves, call Rossby waves, that radiate out at right angles and affect ocean circulation. “That will generate a large-scale shift in temperature and salinity in the ocean,” Timmermann says. “This process takes even longer—let’s say hundreds of years.” Finally, the diffusion of heat from these waves will encompass the world’s oceans, Timmermann says. “But that adjustment is going to take one or two thousand years.”
Even the enhanced trade winds in the equatorial Pacific, that created the warm pool and the hiatus in the first place, are themselves the result of a long-term, long-distance process. Last August, a group of scientists including Timmerman and his colleague, Shayne McGregor, a scientist at the Climate Change Research Center at the University of New South Wales in Australia, demonstrated that these trade winds were the result of warming in the Atlantic, several thousand miles and a continent away.3 The two ocean basins are linked by an atmospheric bridge called the Walker Circulation. One of the major drivers of the world’s climate, the Walker Circulation is a mechanism that reacts to sea surface temperatures. The atmosphere over cold water cools and sinks, creating a high-pressure cell at the ocean’s surface. Similarly, the atmosphere over warm water rises to create a low-pressure cell. Equatorial trade winds then blow from high to low pressure, east to west at the surface, and in the reverse direction at high altitude.

Normally, the Walker Circulation is in effect within one ocean basin. It is most pronounced in the Pacific, where the basin is wide and the temperature differential between east and west is large. But, for the past 20 years, a growing temperature differential between the Atlantic and the eastern Pacific has been helping to drive those record-breaking trade winds in the equatorial Pacific.
“We looked back through the last 100 years,” McGregor says, “More than 30 percent of what’s happening to the winds of the central equatorial Pacific can be explained by the pressure gradient between the Atlantic and the Pacific oceans.”
This is what climate scientists call a “teleconnection,” and its implications, in this case, are big. According to their models, the enhanced Walker Circulation caused by the warming of the Atlantic was responsible for much of the recent climate variability in the Pacific—including the droughts in the American West, changes in the paths of hurricanes, and even, perhaps, the potential end of the hiatus last year. All these changes correlate with a trans-basin process that began more than two decades ago.
In other words, the ultimate cause of both the start and the potential end of the hiatus might not even have been in the Pacific. Rather, it may have been due to yet another mass of warm water—this one lurking in the equatorial Atlantic, on the other side of the world.
All of this comes back to remind us of the all-too-common conflation of the terms “climate” and “weather.” The hiatus turned into a sort of public relations problem for climate scientists, in the same way that a particularly cold winter might prompt your neighbor to say “what global warming?” The time and distance scales at work in climate change are far greater than we’re used to considering. They’re not on the scale that it takes for a storm to form or pass, or for a seasonal cycle of cold or warm winters to run its course. They’re on the scale of nothing smaller or faster than the ocean itself.
Dennis Hollier is a Hawaii-based writer.
References
1. Kosaka, Y. & Xie, S.P. Recent global-warming hiatus tied to equatorial Pacific surface cooling. Nature 501, 403-407 (2013).
2. McGregor, S., Timmermann, A., & Jin, F.F. Wind effects on past and future regional sea level trends in the Southern Indo-Pacific. Journal of Climate 23, 4429-4437 (2010).
3. England, M.H., et al. Recent intensification of wind-driven circulation in the Pacific and the ongoing warming hiatus. Nature Climate Change 4, 22-227 (2014).