Claudius Ptolemy’s monumental astronomy book, the Almagest, established a unified mathematical framework for computing the positions of the sun, moon, stars, and planets at any time in the past, present, or future. So comprehensive and so compelling was the Earth-centered cosmos it described that the Almagest would remain the final word in astronomy for nearly 1,500 years, until it was finally superseded by the sun-centered system of Copernicus and Kepler. Somewhat less well known is that Ptolemy was also the ancient world’s greatest geographer and its greatest, or at least most well-respected, astrologer. Indeed, Ptolemy’s astrology book, the Tetrabiblos, was still required reading at the University of Bologna when Copernicus studied there a millennium and a half later.
Within the Tetrabiblos, Ptolemy’s astronomy, astrology, and geography come together in a remarkable discussion of “astral geography.” Ptolemy’s system for linking terrestrial and celestial real estate endowed his astrology with a sense of space as well as time. It also greatly multiplied the number of correspondences to consider. Ptolemy’s resulting astrological world map is a fascinating document of attitudes toward race and ethnicity in the ancient world. For our modern world, it provides a fun illustration that even our modern methods of analysis are hardly immune from the timeless pitfalls of pattern-matching.
This ancient theory claims attitudes toward homosexuality are distributed along a geographic gradient.
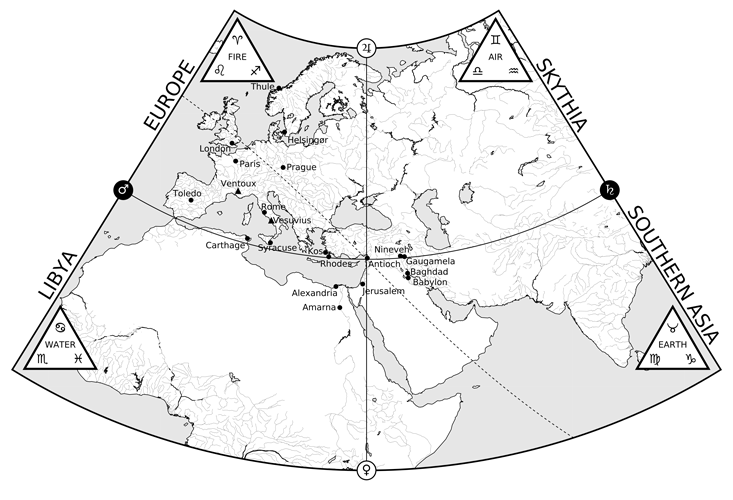
Ptolemy’s basic idea was to divide the inhabited world into four quadrants, according to the zodiac signs assigned to each of the four classical elements, Earth, Air, Water, and Fire. After outlining his basic quadrant scheme, Ptolemy races through a remarkable list of 73 different regions, asserting that the quirks and idiosyncrasies of each one’s inhabitants are merely the natural product of where they reside on his astrological world map. It’s a little bit like reading a glossy travel guide to the ancient world, full of exotic descriptions of far-off lands.
Mostly, though, it’s like listening to a curmudgeonly old man spew a litany of ethnic stereotypes—except that, in this case, most of the ethnicities ceased to exist some 1,500 years ago. Troglodytes? They’re “superstitious, given to religious ceremony, and fond of lamentation.” Pamphylians? “They are exceedingly depraved, servile, laborious, rascally, are to be found in mercenary expeditions, looting and taking captives, enslaving their own peoples, and engaging in destructive wars.” One can only imagine what he had to say about these groups in private!
What separates Ptolemy’s survey from simple jingoism, however, is his attempt to ascribe the ethnic differences he perceived to a set of rational principles. On this account, the Tetrabiblos is one of the earliest examples of what’s sometimes called anthropological ethnology. And unlike the blood-based racial theories which became especially pernicious in America and Europe in the 19th and 20th centuries, Ptolemy’s ethnology is entirely geographical. This makes the Tetrabiblos rightfully the great-grandfather of what’s surely the most famous modern work of geographic anthropology, Jared Diamond’s best-selling Guns, Germs, and Steel. But let’s not be coy here. What really makes Ptolemy’s whirlwind world tour so entertaining is all the sex—or, rather, how candidly Ptolemy discusses the sexual habits of the peoples he describes.
Adding to the Tetrabiblos’s long list of pioneering achievements, we can credit it with being one of the first to examine “astrosexuality,” which is the idea that your sexual predilections and romantic compatibilities are determined by your astrological makeup. Among the gossipy astrosexual tidbits in the Tetrabiblos, the one that comes closest to a general theory is the claim that attitudes toward homosexuality are distributed along a geographic gradient running northwest to southeast. The most tolerant views, according to Ptolemy, are to be found the farther you venture into northwestern Europe and the regions ruled by the fiery triplicity of Aries, Leo, and Sagittarius. Or, as Ptolemy puts it (in the standard, rather polite translation):
Because of the occidental aspect of Jupiter and Mars … they are without passion for women and look down upon the pleasures of love, but are better satisfied with and more desirous of association with men. And they do not regard the act as a disgrace to the paramour, nor indeed do they actually become effeminate and soft thereby, because their disposition is not perverted, but they retain in their souls manliness, helpfulness, good faith, love of kinsmen, and benevolence.”
Conversely, by the time you’ve reached the Middle Eastern countries of the earthy triplicity (Taurus, Virgo, Capricorn), attitudes have become downright hostile, to the point where they “hold in detestation such relations with males.”
Ptolemy’s assertion that acceptance of homosexuality decreases along a line running from London to Riyadh agrees pretty well with what I imagine is the current conventional wisdom on the matter. Could he be on to something? To add a quantitative veneer to this question, we can use that favorite tool of data analysts everywhere: a linear regression.
Linear regression is one of several techniques used to gauge how strongly two lists of numbers are correlated. One of these lists, for instance, could be scores indicating how positively or negatively homosexuality is viewed in each country. As an especially detailed example, there’s the Spartacus Gay Travel Index, published every year as part of the Spartacus International Gay Guide. In the Spartacus Gay Travel Index for 2017, each country is given points in 14 different categories, ranging from the application of the death penalty for homosexuality to the legal status of gay marriage. Adding these points together results in a more or less continuous score from +9 (Sweden and the United Kingdom) to –14 (Somalia). (The United States, incidentally, only ekes out a 4.)
Of course, this list ultimately represents nothing more than the subjective assessment of the editors of the Spartacus International Gay Guide, but since their methodology is applied in a consistent way using publicly available data and—most importantly—it includes every country, it gives us an excellent list to use. Besides, what data set could be more appropriate for a Roman-themed regression than one named after Spartacus, the leader of Rome’s most fearsome slave rebellion, who made his encampment on Mount Vesuvius?

As for the second list of numbers, these should indicate how far each country is situated in either the northwestern regions ruled by the fiery triplicity or the southeastern regions ruled by the earthy triplicity. If all we needed was an east–west measure, things would be easy. In that case we could just take the longitude of each country’s capital city. Our situation is really no different. We can simply tilt the globe so that its new equator becomes the great circle passing through the center of Ptolemy’s astrological world map at a 45-degree angle. (This is the dotted path drawn in Figure 1 above.) Then the “longitudes” computed with respect to this new equator will serve as a measure of the “fieriness” or “earthiness” of any location. So, are these two lists of numbers correlated?

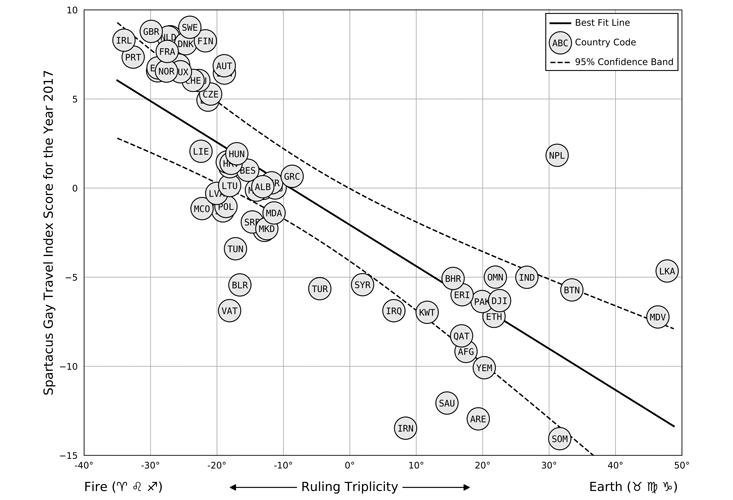
A linear regression (Figure 2, above) suggests that they are. Specifically, the regression’s best-fit line tells us that for every 10 degrees of “fire–earth longitude” we travel, we can expect the Spartacus Gay Travel Index score to drop by about two and a half points. Regressions like this are a fixture of technical and scientific reports, but what do they really mean? If we’re being fair, shouldn’t this analysis, which indicates that a correlation does exist, compel us to accept Ptolemy’s astrosexual theory? Not so fast. As the saying goes, correlation does not equal causation. With enough data sets to choose from, it’s not difficult to find two that are correlated, and it can become a bit of a sport to pick out the most absurd or humorous cases. (For example, the correlation between the number of civil engineering doctorates awarded per year and mozzarella cheese consumption in the United States.)
With enough data and ingenuity, the “mathematician” can generally make whatever connections he or she wants.
But if so many correlations are spurious, then why bother reporting them at all? This is an important question, especially since misrepresenting correlations is undoubtedly the most common way people use statistics to deceive both themselves and those around them. One answer is that a strong correlation does indeed provide evidence in support of a theory, even if it must remain just one piece among many. How the pieces are to be weighed is ultimately a question of human judgment, one for which no single algorithm, test, or procedure will ever fully substitute. As a case in point, the data we’ve plotted in Figure 2 are hardly the only information we can bring to bear on the question of geographical attitudes toward homosexuality.
It’s no secret, for instance, that northwestern Europe historically, and even quite recently, was not especially welcoming toward homosexuals. Indeed, when the great Victorian explorer Richard Burton developed his own theory of geographically-influenced sexuality, the Middle East was explicitly included, and England excluded, from his map of what he termed the “Sotadic Zone”—a region where homosexuality was supposedly natural, accepted, and common. Were Figure 2 to be redrawn with data from 150 years ago, it’s altogether likely that the best-fit regression line would have entirely the opposite slope. Yet a correlation that shifts from one moment to the next undermines any argument that there’s a fixed principle at work. Instead, perhaps the only constant uniting Ptolemy’s and Burton’s theories is that each imagined the sexual mores of faraway lands to be radically different from what he knew back home, and each projected his disgust or desire accordingly. That’s hardly the story you would get if the only information you had was the cold and context-free data of Figure 2. Trying to figure out which story, if any, is hiding in your data is challenging expressly because there are usually multiple stories which can be crafted, and deciding which one to emphasize rarely has anything to do with the data itself.
In the Tetrabiblos, Ptolemy intimates an awareness of this problem when he pauses to reflect upon the sheer number of astrological possibilities:
It is of course a hopeless and impossible task to mention the proper outcome of every combination and to enumerate absolutely all the aspects of whatever kind, since we can conceive of such a variety of them. Consequently questions of this kind would reasonably be left to the enterprise and ingenuity of the mathematician …
But what astrology teaches us, and what Ptolemy perhaps failed to appreciate, is that with enough data, and with enough enterprise and ingenuity, the “mathematician” can generally make whatever connections he or she wants. And therein lies the danger. Because, as with exploring the world, so too with data: All too often, you find only what you were looking for.
Alexander Boxer has a doctorate in physics from MIT, a master’s degree in the History of Science from Oxford, and a bachelor’s in Classical Languages from Yale. His technical research has appeared in journals such as Nature Physics and he was Atlas Obscura’s original Washington, D.C., “Field Agent.”
Excerpted from A Scheme of Heaven: The History of Astrology and the Search for Our Destiny in Data by Alexander Boxer. Copyright © 2020 by Alexander Boxer. Used with permission of the publisher, W. W. Norton & Company, Inc. All rights reserved.
Lead image: Willy Barton / Shutterstock


