In 1989, scientists at the United States Fish and Wildlife Service and the National Zoo published a study on migratory songbirds with alarming results. The study relied on 22 years of data from annual surveys of more than 60 neotropical species, birds that breed in North America and overwinter in Central and South America. And the numbers showed that more than 70 percent of these populations, many of which had been stable or growing only a decade earlier, were now plummeting.
Ted Simons was a young wildlife biologist with the National Park Service at the time. To help determine the cause of the apparent declines, his team conducted its own surveys, in the Great Smoky Mountains of Tennessee. Their methods were essentially the same: Groups of trained counters walked along backcountry trails, stopping at prescribed points to count all the birds they saw or heard. However, they included some additional data points, such as the approximate distance between the observer and each bird counted. This extra information allowed them to more accurately calculate the probability of detecting individual birds—a factor that could influence the final estimate. When they analyzed their data, they found reason to question the magnitude of the declines flagged by the 1989 study. Although some species were in fact dwindling, according to follow-up studies, others were likely larger than they had originally seemed.
Animal tallies can get distorted by changes in weather or climate, challenging terrain, or variations in an animal’s range, timidity, or grouping behavior.
Puzzled, Simons ran some tests. In a series of experiments in the mid-2000s, he and his colleagues at North Carolina State University (where Simons is now a professor) broadcast simulated bird and frog chirps into a patch of oak-hickory forest and measured how accurately trained counters identified the calls. Expectedly, there were errors. But what struck Simons most was that the counters tended to make certain mistakes in a systematic way, producing biases in the data. The causes were widespread. Surveys of veteran observers, for example, revealed that hearing loss was common. Background noise, such as from traffic or construction, also skewed counts—making quieter or shier species seem more rare than they actually were. And if counters expected to hear a particular species—because it was common to the area, for example—they often reported observing it, even if its call was never broadcast.
The problem, Simons says, is that the statistical models used to extrapolate total population estimates from observer counts don’t always account for these biases. So it’s easy to get the numbers wrong. “Often what it comes down to is we’re missing more animals than we realize,” Simons says.

Animal tallies can get distorted in other ways, too: by changes in weather or climate, challenging terrain, or variations in an animal’s range, timidity, or grouping behavior. As a result, even some of the most rigorous population surveys have a margin of error of around 10 to 20 percent. Some calculations produce absurdly large ranges. For example, wildlife experts estimate that there are between 450,000 and 700,000 elephants in Africa and between 500,000 and 1 million moose in Canada.
These miscounts can influence policy, including decisions about which animals should get listed under the U.S. Endangered Species Act, how many hunting tags to issue, and how to deal with a changing climate or ecosystem. “Everything hinges on how many, and how many is inherently error-prone,” says Douglas Smith, senior wildlife biologist at Wyoming’s Yellowstone National Park. “Wildlife doesn’t want to be counted.”
In many cases, though, new technologies, together with more sophisticated statistical models, are beginning to refine population estimates. Ringed seals and spotted seals, for example, are notoriously difficult to count using traditional naked-eye aerial surveys; the two species look so similar from the air that counters often mistake one for the other. But recently, scientists at NOAA’s National Marine Mammal Laboratory, in Seattle, rigged small airplanes with infrared cameras to detect “hot spots” on the ice. When a warm body was spotted, the system snapped a digital picture of the animal for identification. Models then corrected for errors. “We are producing the first rigorous estimates thanks in large part to [this] technology,” says Brett McClintock, a statistician on the NOAA team.
Even as the accuracy of animal counts improves, estimates will always be imperfect. The world is forever changing.
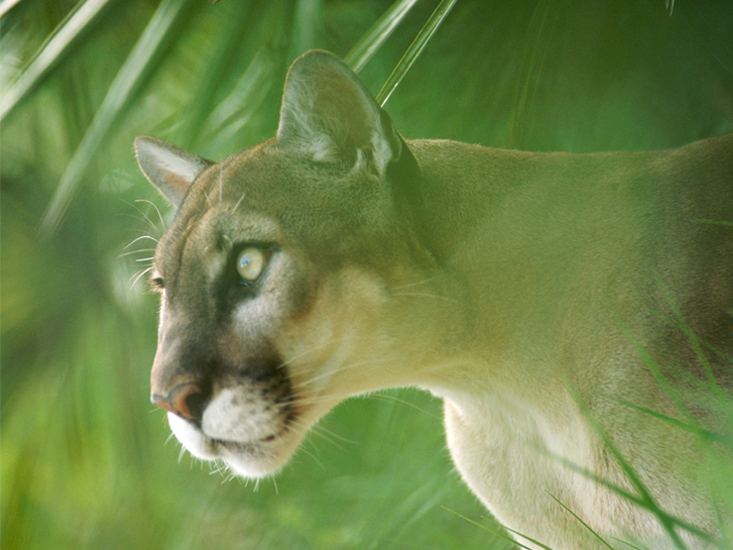
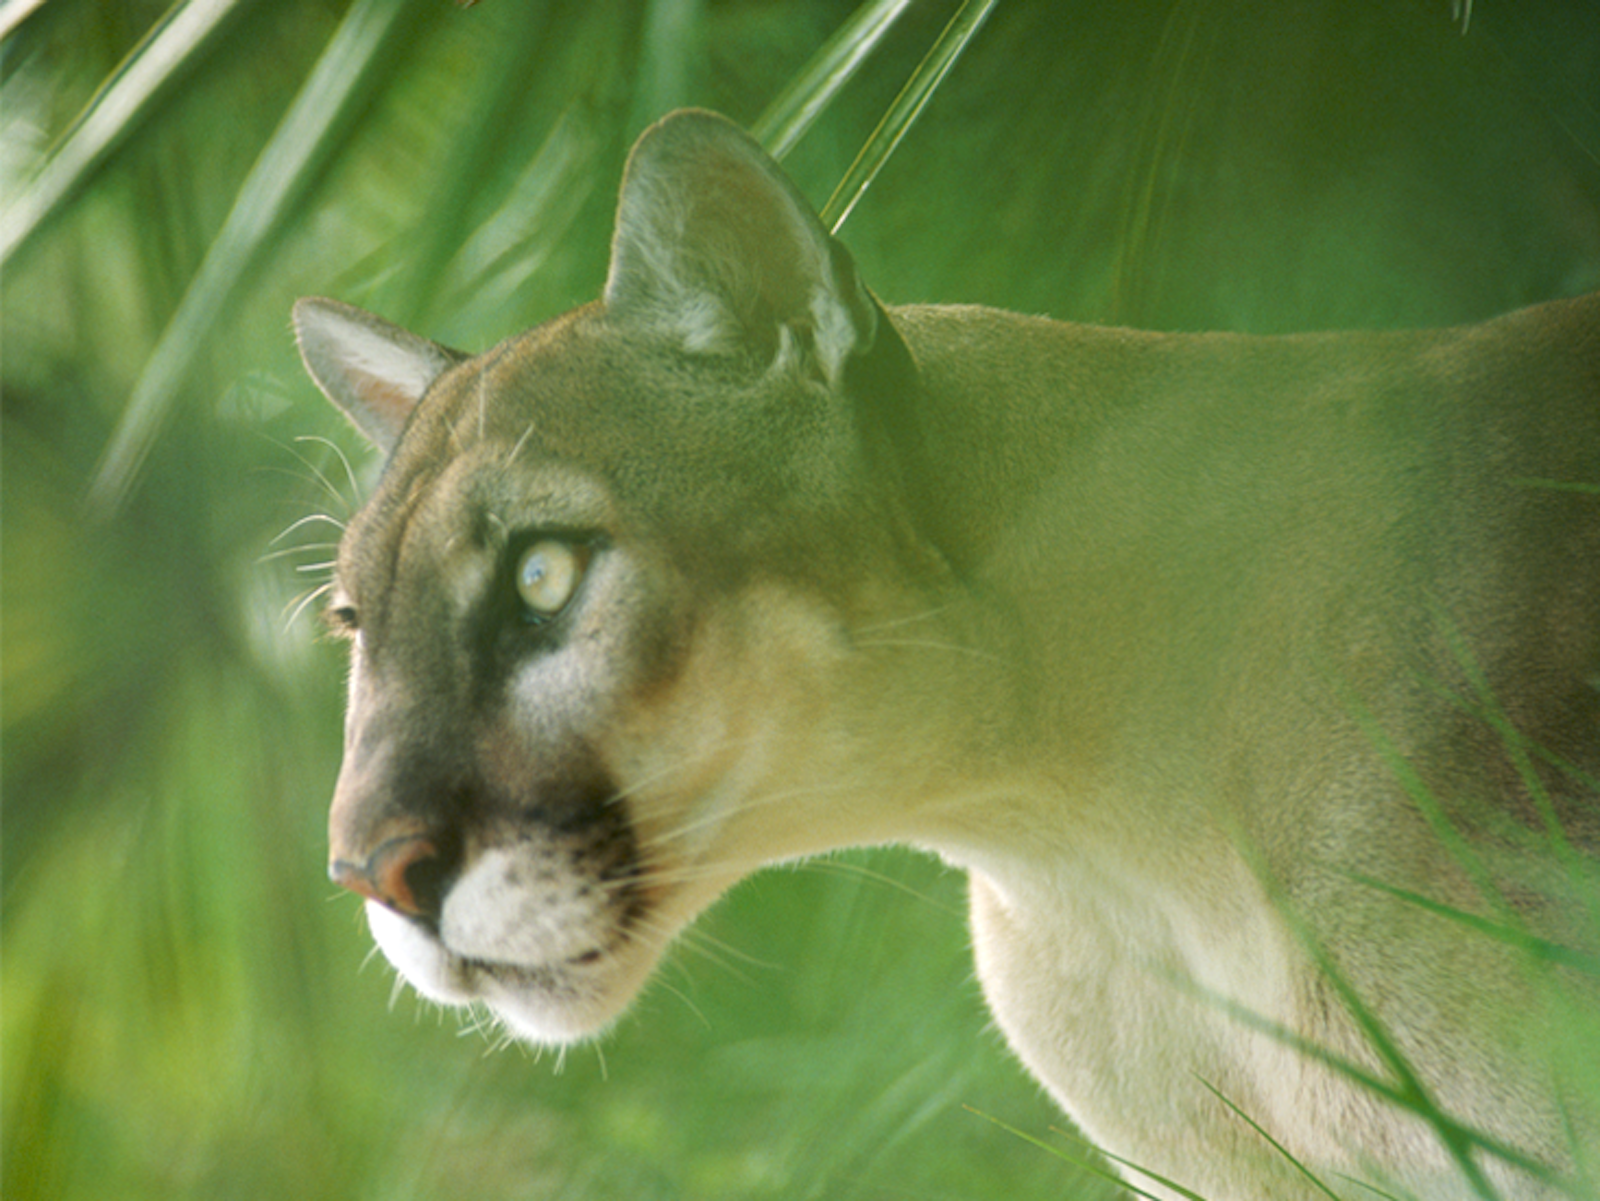
Modernized counting methods, he adds, are also enabling some of the “first statistically defensible estimates for the more difficult-to-study species,” such as whales and leopards, which are very good at avoiding detection. “Many of these species have evolved to be elusive,” McClintock says. His team also studies Florida panthers, which once ranged over eight states, from Louisiana to South Carolina. By the 1980s, scientists concluded that there were only about 20 individuals left, all in south Florida. McClintock suspects that number is an underestimate (although he doesn’t doubt the cats came close to extinction). Early surveyors counted panthers by walking their enormous range, he says, looking for signs that the animals had passed through. “They would try to guess things, like, ‘Is this the same paw print we saw over there?’ ”
Since then, researchers have put radio collars on dozens of these big cats. And McClintock’s team has devised a clever way of calculating the rest. By comparing the total number of collared cats with the proportion killed by cars each year, they can extrapolate a pretty good estimate of the whole population. In a study forthcoming in the Journal of Applied Ecology, they conclude that there were likely no more than 150 panthers in the U.S. between 2000 and 2012.
Other surveyors are taking advantage of gene sequencing technologies. In anticipation of a 2017 deadline to decide whether to list the Pacific walrus as an endangered species, for instance, researchers with the U.S. Fish and Wildlife Service are sampling the population with retractable biopsy darts shot from a crossbow. The previous survey, completed in 2006 using aerial sightings, suggested a total count between 55,000 and 507,000. “The last number was so imprecise we really couldn’t do anything with it,” says Jim MacCracken, a wildlife biologist in the group. With genetic analyses, his team can extrapolate population size by comparing the number of individuals re-sampled from one year to the next, thereby narrowing the margin of error.
Yet even as the accuracy of animal counts improves, estimates will always be imperfect. The world is forever changing. As Simons points out, the renowned North American Breeding Bird Survey, which produced data for the landmark 1989 study, happens every year during the first couple weeks of June. But due to climate change, spring is arriving earlier, which means that birds are breeding earlier, and their singing behavior is shifting—a change that could affect detection rates.
“This is a very sloppy business of counting animals, and it always will be,” Simons says. “The goal of the work we’re doing—and the work of others who have put a lot of thought into these questions—is to ask, ‘Can we get a little bit closer to the truth?’ ”
Emily Sohn is a freelance journalist in Minneapolis. Her stories have appeared in Nature, the Los Angeles Times, Hakai, Science News, and Discovery News, among other publications.


