

The 2020 Democratic candidates are out of the gate and the pollsters have the call! Bernie Sanders is leading by two lengths with Kamala Harris and Elizabeth Warren right behind, but Cory Booker and Beto O’Rourke are coming on fast! The political horse-race season is upon us and I bet I know what you are thinking: “Stop!”
Every election we complain about horse-race coverage and every election we stay glued to it all the same. The problem with this kind of coverage is not that it’s unimportant. Who’s leading a particular race and by how much can matter a great deal to someone trying to decide which candidate to volunteer time or money to, or even whether it’s worth learning the policy positions of a fringe candidate with no chance of winning. The problem is the well-documented incentive for the media to make every race seem closer than it is, what Erika Fry in the Columbia Journalism Review called “rooting for the race.”
Those who simply want to know how the candidates stack up and who seek a more objective, quantitatively rigorous alternative to punditry have in recent years turned to such data journalism sources as Nate Silver’s FiveThirtyEight. But even they are feeling burned by 2016. Silver, who scored on both Obama victories, had Trump as a distant longshot in the primary and Clinton as a 71 percent favorite to make the winner’s circle in the general. Data-centered political coverage, as a whole, took a serious blow.

Silver issued a partial mea culpa for the primary forecasts. But he has steadfastly defended the general election forecast with the arguments that (1) his model had given Trump better chances than nearly anyone else had, and (2) something having a 29 percent chance of happening doesn’t mean it’s impossible. Maybe the underdog got lucky. The latter defense, though, revealed a destabilizing truth about the nature of such forecasts that took many readers by surprise: Since all the forecasts are probabilistic, meaning they’re not strictly wrong in the event of an upset victory, then in what sense had they ever been right?
This presidential season we have an opportunity to do better. It starts with setting some new standards. We need a way of evaluating forecasts that moves beyond a simple right and wrong dichotomy. Most of all, we need to employ the mathematical tools of probability to tell us when an unlikely outcome is damning for a forecast and when it is not. I realize the language of probability does not come naturally to most people. Except for rare trips to a casino, we don’t often converse in probabilistic terms. To help you become a discerning news consumer in the coming elections, here are four key principles of probability to help you keep election forecasting in context.
1. Something Improbable Will Happen, Probably
A common trope among News of the Weird stories is the Incredible Coincidence: A couple has three children with the same birthday in separate years, a man and his brother are both hit by trains while bicycling in different countries on the same day, and so on. Often these stories are accompanied by a quote from a statistics professor giving the odds against such a thing happening by chance: 1 million to 1, 1 billion to 1, or colorfully comparing the probability to that of other rare events, like winning the Powerball lottery and then being struck by lightning on the way home.
These coincidences are much more common than we tend to think, owing mostly to the large number of possible chances each coincidence is given to happen (the large number of three-child families in the world, say) and the number of such events that we would recognize if given the chance (e.g., we would care just as much if the brothers had been sisters, and if they had been hit by cars instead of trains). The mathematicians Persi Diaconis and Frederick Mosteller called this the Law of Truly Large Numbers: With a large enough sample size, any outrageous thing is bound to happen. So, given the sheer number of caucuses, straw polls, primaries, and down-ballot races we are about to witness, we may be certain that some wacky result will occur. This is fine.
You can easily produce an outcome never seen before in human history and never to be repeated.
Something left unstated, though, is why the occurrence of something highly improbable should be inherently noteworthy at all. For example, here is a way to produce an outcome almost certainly never seen before in human history and never to be repeated: Shuffle a deck of cards. The resulting deck, assuming the cards are shuffled correctly, should only occur on average every 52 *51 *50 *… *2 *1 shuffles, because this is the number of possible permutations of 52 cards, all equally likely. This number is incomprehensibly large, on the order of 1068, or 100,000,000,000,000,000,000,000,000,000,000,000,000,000,000,000,000,000,000,000,000,000,000. Every person on earth could shuffle cards once every nanosecond for the expected lifetime of the universe and not even put a dent in that number. So why is there not a news story written every time a deck is shuffled about the astronomically unlikely event that just took place? Why aren’t statisticians brought in to comment that this was like winning the Powerball eight times in a row?
The reason is the vast majority of those possible shuffles do not contain any recognizable pattern that is suggestive of any alternative hypothesis other than pure chance. These alternatives are often lurking in the background as unlikely suspects until some particularly improbable data reveals them. For example, under the assumption that a particular coin is fair, the sequences of 20 coin-flips:
HHTHTTHTHHHTTTTHTHHT and HHHHHHHHHHHHHHHHHHHH
have exactly the same probability: ≈ 1 in 1 million, but only the latter is suggestive of an alternative hypothesis: that the coin is biased, or even has heads on both sides, making the observed outcome certain.
What this means for election forecasts is that something improbable happening (say, Dwayne “The Rock” Johnson being the Democratic nominee in 2020—currently about a 1 percent chance according to PredictIt.org) is not necessarily interesting merely because it was improbable, unless it counts as evidence against some underlying assumption that factored into the probability estimation: that a particular coin is fair or that a major party is unlikely to nominate a former wrestler with no experience in politics.
The mathematical tool that sorts the interesting coincidences from the meaningless ones is Bayes’ theorem, which dictates exactly how any given observation should cause us to update our probability assignment for a given hypothesis from among a class of alternatives. The essential insight of the theorem, first developed by Thomas Bayes in the 1750s, is that the probability we assign the hypothesis in light of the observation (the “posterior” probability) is proportional to the probability we gave it before making the observation (the “prior”) and the likelihood of that observation if the hypothesis were true (the “conditional” probability).
So Bayesian reasoning can help us detect patterns like those above, but only if we allow for possible alternatives and their prior probabilities. For example, if we initially assumed only that a coin is very probably fair but had, say, a 1 in 10,000 chance of it being double-headed (maybe we’ve heard of the existence of such coins but consider them extremely rare), then after 20 consecutive heads, Bayes’ rule would lead us to compare the two quantities:
9999/10000 * (½)20 vs. 1/10000 * 1
And our posterior probability assignment for the double-headed coin theory would be about 99 percent. The unlikeliness of the data under the assumption of chance would have elevated this theory from itself being very unlikely to being near certain. This is why particular forms of unlikely occurrences are so noteworthy: They carry an enormous potential energy like a coiled-up spring that could be released to launch an unlikely alternative hypothesis, such as the idea that something other than chance is at work or that a fundamental assumption about American politics is wrong, into the heights of near certainty.
2. Probabilities May Go Up and Down Dramatically as Events Unfold
In addition to calling out FiveThirtyEight’s models for apparently whiffing on the 2016 general election, a number of critics have latched onto a second point: that the forecast probabilities fluctuated too much leading up to the election. Silver’s forecast for Clinton’s chance of winning may have finished at 71 percent, but over the last five months before the election, it bounced up and down between 55 percent and 85 percent. According to the critics, this was evidence of some fundamental instability in the model or, even worse, a complete failure to capture uncertainty in the right way. The fluctuation seems especially glaring given that her poll numbers were relatively stable over that period; FiveThirtyEight showed her as a steady 2-6 point favorite nationally. What changed?
Mainly what changed was Clinton’s performance in several key states like Florida, Pennsylvania, Ohio, Michigan, and Wisconsin, and the implications this had for the electoral college. Even though her national polls numbers showed a comfortable margin, the margins in some of the swing states were always razor thin.
In the absence of a quantitative scale, we may fall back on narratives that dismiss evidence in favor of our own biases.
For his model’s inability to maintain a more circumspect attitude and project a steady probability that Clinton could lose, then, Silver was roundly criticized. Nassim Nicholas Taleb, mathematical philosopher and author of The Black Swan, called Silver “ignorant of probability,” a “fraud,” and “a total impostor.” Mathematically speaking, though, there’s no reason the forecast probability could not have fluctuated more, even given minor variations in the polls.
As a thought-experiment to illustrate how this could work, imagine we were betting on a sequence of 1,000 coin-flips (representing daily fluctuations in a candidate’s poll numbers), and all we care about is finishing with a net profit at the end (representing an electoral win). We get to choose the amount of each bet, but that amount must be held constant for all the flips. Because of this assumption, we’d notice pretty quickly that the amount we bet didn’t matter. All that does matter is the sequence of heads and tails. The more we gamble per flip, the more volatile our fortunes become, but if the past and future volatility are the same, then at any given midway point, say after the 500th flip, the chance of finishing better than we started only depends on the results of the coin-flips thus far, meaning it will have the same amount of variability whether we’re betting $1/flip or $1 million.
At the beginning of the game, our chance of winning is 50/50. The graphs below show how that chance would unfold through time for a given sequence of coin-flips. On the left we assume a bet amount of $1; on the right $1 million. But apart from the caption, the graphs are exactly the same. In both cases, swings in probability from 20 percent to 80 percent are not unlikely at all.
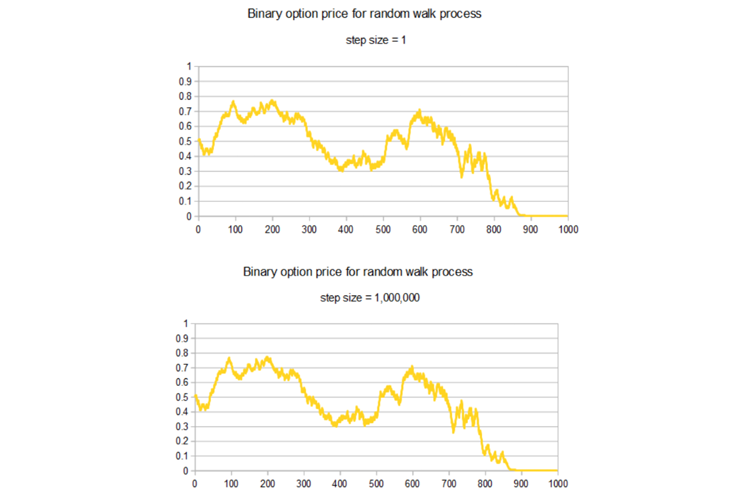
A similar phenomenon can manifest in election forecasting. It may be totally fine for forecast probabilities to fluctuate as much as FiveThirtyEight’s did in 2016; roughly speaking, all that’s required is an assumption that the volatility in the polls is constant in time. If the polls are fairly stable, this means the forecast probabilities may bounce around much more than the polls do. The size of these fluctuations in probability will be particularly large when the polls are close to 50/50, as they were in several of the key states in 2016.
It’s a common misconception to think of probability as a fixed, measurable quantity of a physical system, like mass or specific heat. The important principle to remember is that probability is ultimately about information, and as new information is revealed, our probabilities can and should change as a result. Sometimes these changes may be dramatic. In the case of Clinton vs. Trump, this meant large oscillations in each’s forecast chance of winning, despite (or, in fact, because of) the stability in the polls. When a contest is balanced on a knife’s edge as it was in 2016, any minor wobble could send it falling one way or the other.
3. Some Probabilities Should Match Frequencies, but That’s Not the Whole Story
So, how should we assess the quality of probabilistic election forecasts, and in particular the apparent disaster in 2016? Shouldn’t Silver’s models have given Trump a more reasonable chance?
What counts as reasonable? The thing that makes modeling messy real-world phenomena different from simple dice and card games is that often there is no way to verify that a probability assignment was “correct.” These rare events are not predictable the way rolling a double-six is, but may instead depend on factors that will never repeat and perhaps could not have been anticipated. Arguably the shock to the polls caused, say, by James Comey’s letter 11 days before the election informing Congress that the FBI had discovered new evidence in its investigation of Clinton’s emails, was included in the FiveThirtyEight models; it was just a random fluke that it happened when it did and had the effect that it had. Faced with the information available at the time, it could reasonably have been considered very unlikely.
However, over many such instances, if the unexpected keeps happening, it could be evidence that the model is incomplete. Silver has mostly defended his probabilities by saying, in effect, that his models only get blindsided exactly as much as they themselves predict they will. While it’s impossible to validate an individual forecast on its own, according to Silver, if x percent of the candidates that he gave an x percent chance of winning went on to win, then his forecasts were right. As he said on Twitter, “It’s not complicated.”
It is, however, not so simple.
First, there is always an inherent problem with attempting to validate probability using frequency. If you think a coin-toss is 50/50, just flip the coin over and over, and eventually you can be pretty confident whether the coin is balanced. This is called frequency validation, and even forecasts for some more complex systems such as weather can be examined in this way. Since the conditions and the forecasts change from day to day, something like the chance of rain can never truly be tested against a frequency by repeating that exact day many times, but since all days are subject to the same underlying models of weather systems, too much divergence between forecast probabilities and observed frequencies could indicate a model assumption was wrong. But probabilities for obviously one-time events, say the chance of a global recession or nuclear war in 2019, make frequency validation close to meaningless.
This is the question facing an election forecaster like Silver: Is each election, especially one featuring a uniquely norm-defying character like Trump, best considered a one-time event? Or, are there certain factors (demographics, party affiliations, the relationship between polling numbers and voting percentages) that can be tested by comparing probabilities against observed frequencies? For the analysis to be meaningful, the events must all be alike in some ways. But are all elections alike enough?
Even if we decide it’s reasonably safe to apply frequency validation to elections, the agreement between probability and observed frequency is only part of the story of what makes a forecast good. Say, for example, a climatologist knew that on average there were about 90 rainy days per year (about a 25 percent rate) for your area. They could say every day that the next day’s chance of rain was 25 percent and, over the course of many years, do quite well by Silver’s standard; the observed frequencies would closely match the forecast probabilities. However, those forecasts would be practically useless for someone trying to decide whether to bring an umbrella on a particular day.
Better forecasts are more specifically based on that day’s conditions—and indeed real meteorologists measure their performance with something called a “Brier score,” which rewards not only their “reliability” (frequency validation) but also their “resolution” (how much they vary from forecast to forecast), so forecasters can’t cheat by repeating the average probability every day. Without getting bogged down in the formulas, the idea of the Brier score is to punish a forecast according to the difference between the probabilistic forecast and a perfectly deterministic forecast that says flatly that the observed event is certain to occur. It would reward an election forecaster for seeking out all available information and making bold calls with probabilities close to 100 percent, assuming their chosen favorite went on to win. In effect, the Brier score incentivizes forecasters to try to answer the question, “What will happen?” Silver hasn’t publicly graded his own models with Brier scores, but given that they generally end up with probabilities above 95 percent and are close to being deterministic anyway, it’s likely that they would perform well.
4. Probabilistic Forecasts Are Imperfect, but They’re Better than the Alternative
Probability has been the mathematical language of uncertainty for over 300 years and has shown its usefulness in wide-ranging contexts from gambling to meteorology, economics, and political science. Used properly, it can help us learn from observation and construct better forecasts of what’s to come. But such forecasts are always subject to possibly flawed model assumptions. There will always be room for improvement. As the Danish aphorism goes: “It is difficult to make predictions, especially about the future.” What recent experience has taught us is that the alternative—listening to paid spokespeople and pundits, often biased toward conflict, prone to spin tales about momentum and upsets—is worse.
This is where the mathematics of probability can offer us the greatest value. In the absence of a quantitative scale of uncertainty, we may either fall back on narratives that dismiss evidence in favor of our own biases, or throw up our hands and say, “Anything’s possible.” Probability gives us a third option: We can consider a hypothesis (a coin has two heads; Trump will be elected) to be unlikely at first, but change our minds after accumulating evidence in its favor. In the face of enough evidence we may even inch up on certainty. Simple examples like betting on coin-flips serve as a warning that the results can be counterintuitive. But overcoming our intuition is often necessary in a complex world and, if done right, can be as exhilarating as the Kentucky Derby.
Aubrey Clayton is a mathematician living in Boston.