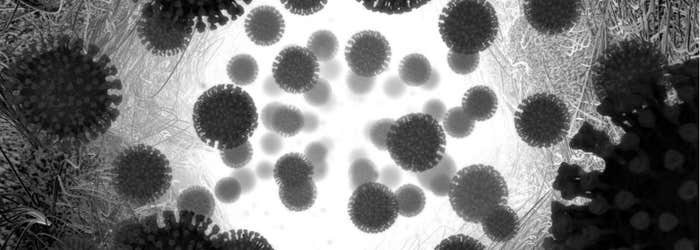


When COVID-19 began to surge in cities around the world, many scientists whose work was not directly tied to the pandemic response were asked to stay away from their workplaces to limit the spread of the virus. But even without access to tissue samples or biosafety facilities, many researchers were able to make important discoveries about SARS-CoV-2, the novel coronavirus that causes COVID-19.
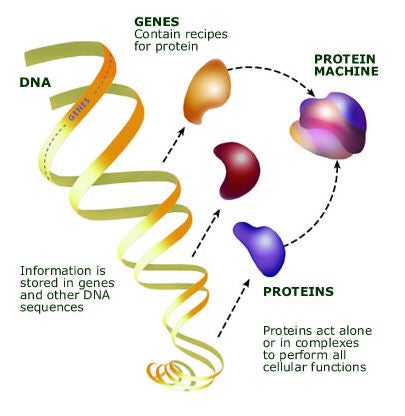
Digging into data generated before COVID-19 had even emerged, researchers identified unexpected tissues to which the new virus could likely gain access and found possible explanations for why some people seemed more at risk for severe cases of the disease. Relevant data were available because researchers are now able to track vast sets of biological molecules at a time (and are more likely to share such information widely). Thirty years ago, if scientists wanted to know which kinds of cells produce the receptor that lets a virus inside, they had to zero in on the gene that encodes that receptor and study its expression in each cell type directly. But now, we are living through a so-called “omics revolution,” with new technologies that make cellular analyses much more comprehensive.
These transformative, high-throughput techniques have been developed and optimized by researchers seeking a deeper understanding of basic biology. Researchers use them to gain a big-picture view of which genes are in use in a cell, tissue, or organism at a particular moment in time or to profile complete sets of proteins or small molecules. These tools have offered new views of how cells work. Now, they’re helping the scientific community understand SARS-CoV-2 and its effects.
The Start of the Genomic Revolution
By the 1990s, a genomic revolution had begun. Scientists were using efficient new technologies to piece together organisms’ entire genetic codes. While an international team of scientists labored for more than a decade to sequence the entire human genome, organisms with smaller, more accessible genomes were also proving vital for unlocking fundamental principles of biology.
In 1996, scientists finished sequencing the yeast genome. It was the first sequenced genome of a eukaryote—an organism whose DNA is contained within a nucleus. Yeast has a long history of use in genetics research. Many of its genes have closely related counterparts in more complex organisms, including humans, and studying the single-celled fungus has illuminated cellular functions that are essential to organisms separated by a billion years of evolution. Sequencing the yeast genome revealed more than 6,000 potential genes, most of whose functions were unknown. At the time, figuring out how and when a cell uses its genes required a painstaking gene-by-gene approach—but that soon changed.
“We’d meet some biologists who’d say, ‘I don’t understand why it would be useful to measure more than one gene at a time,’” recalls Chan Zuckerberg Biohub co-president Joe DeRisi. Now, he says, profiling complete transcriptomes has become an expected component of molecular biology.
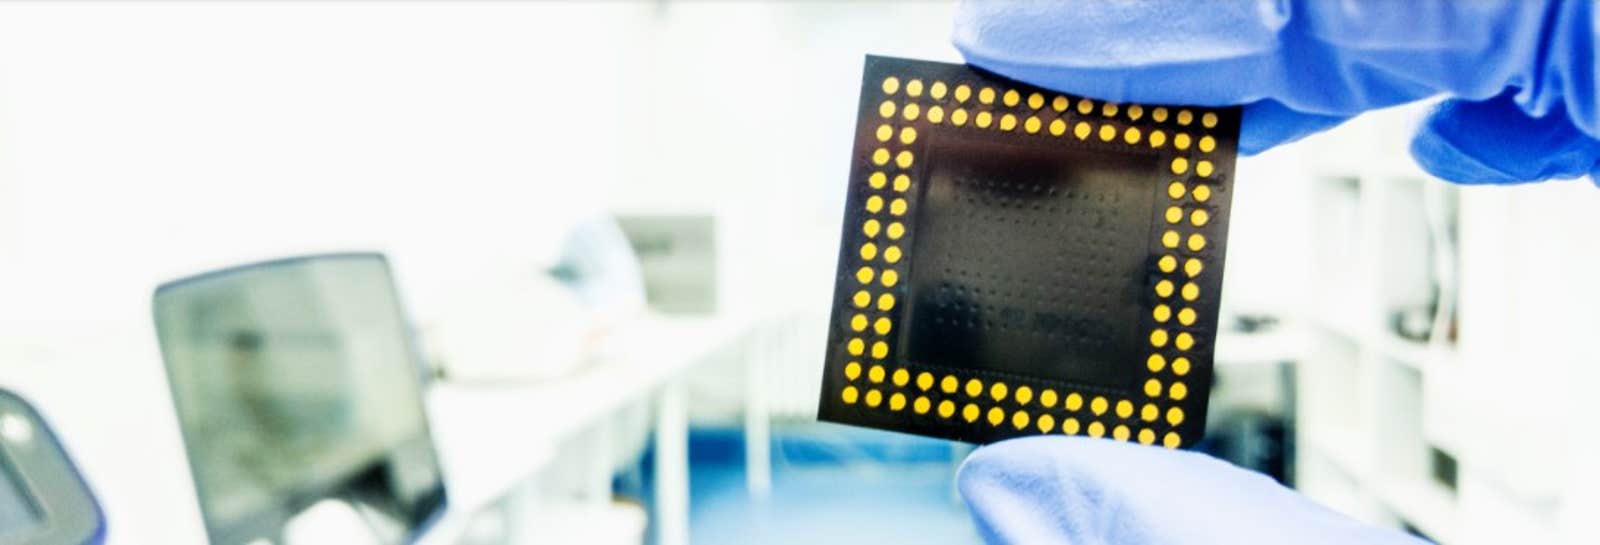
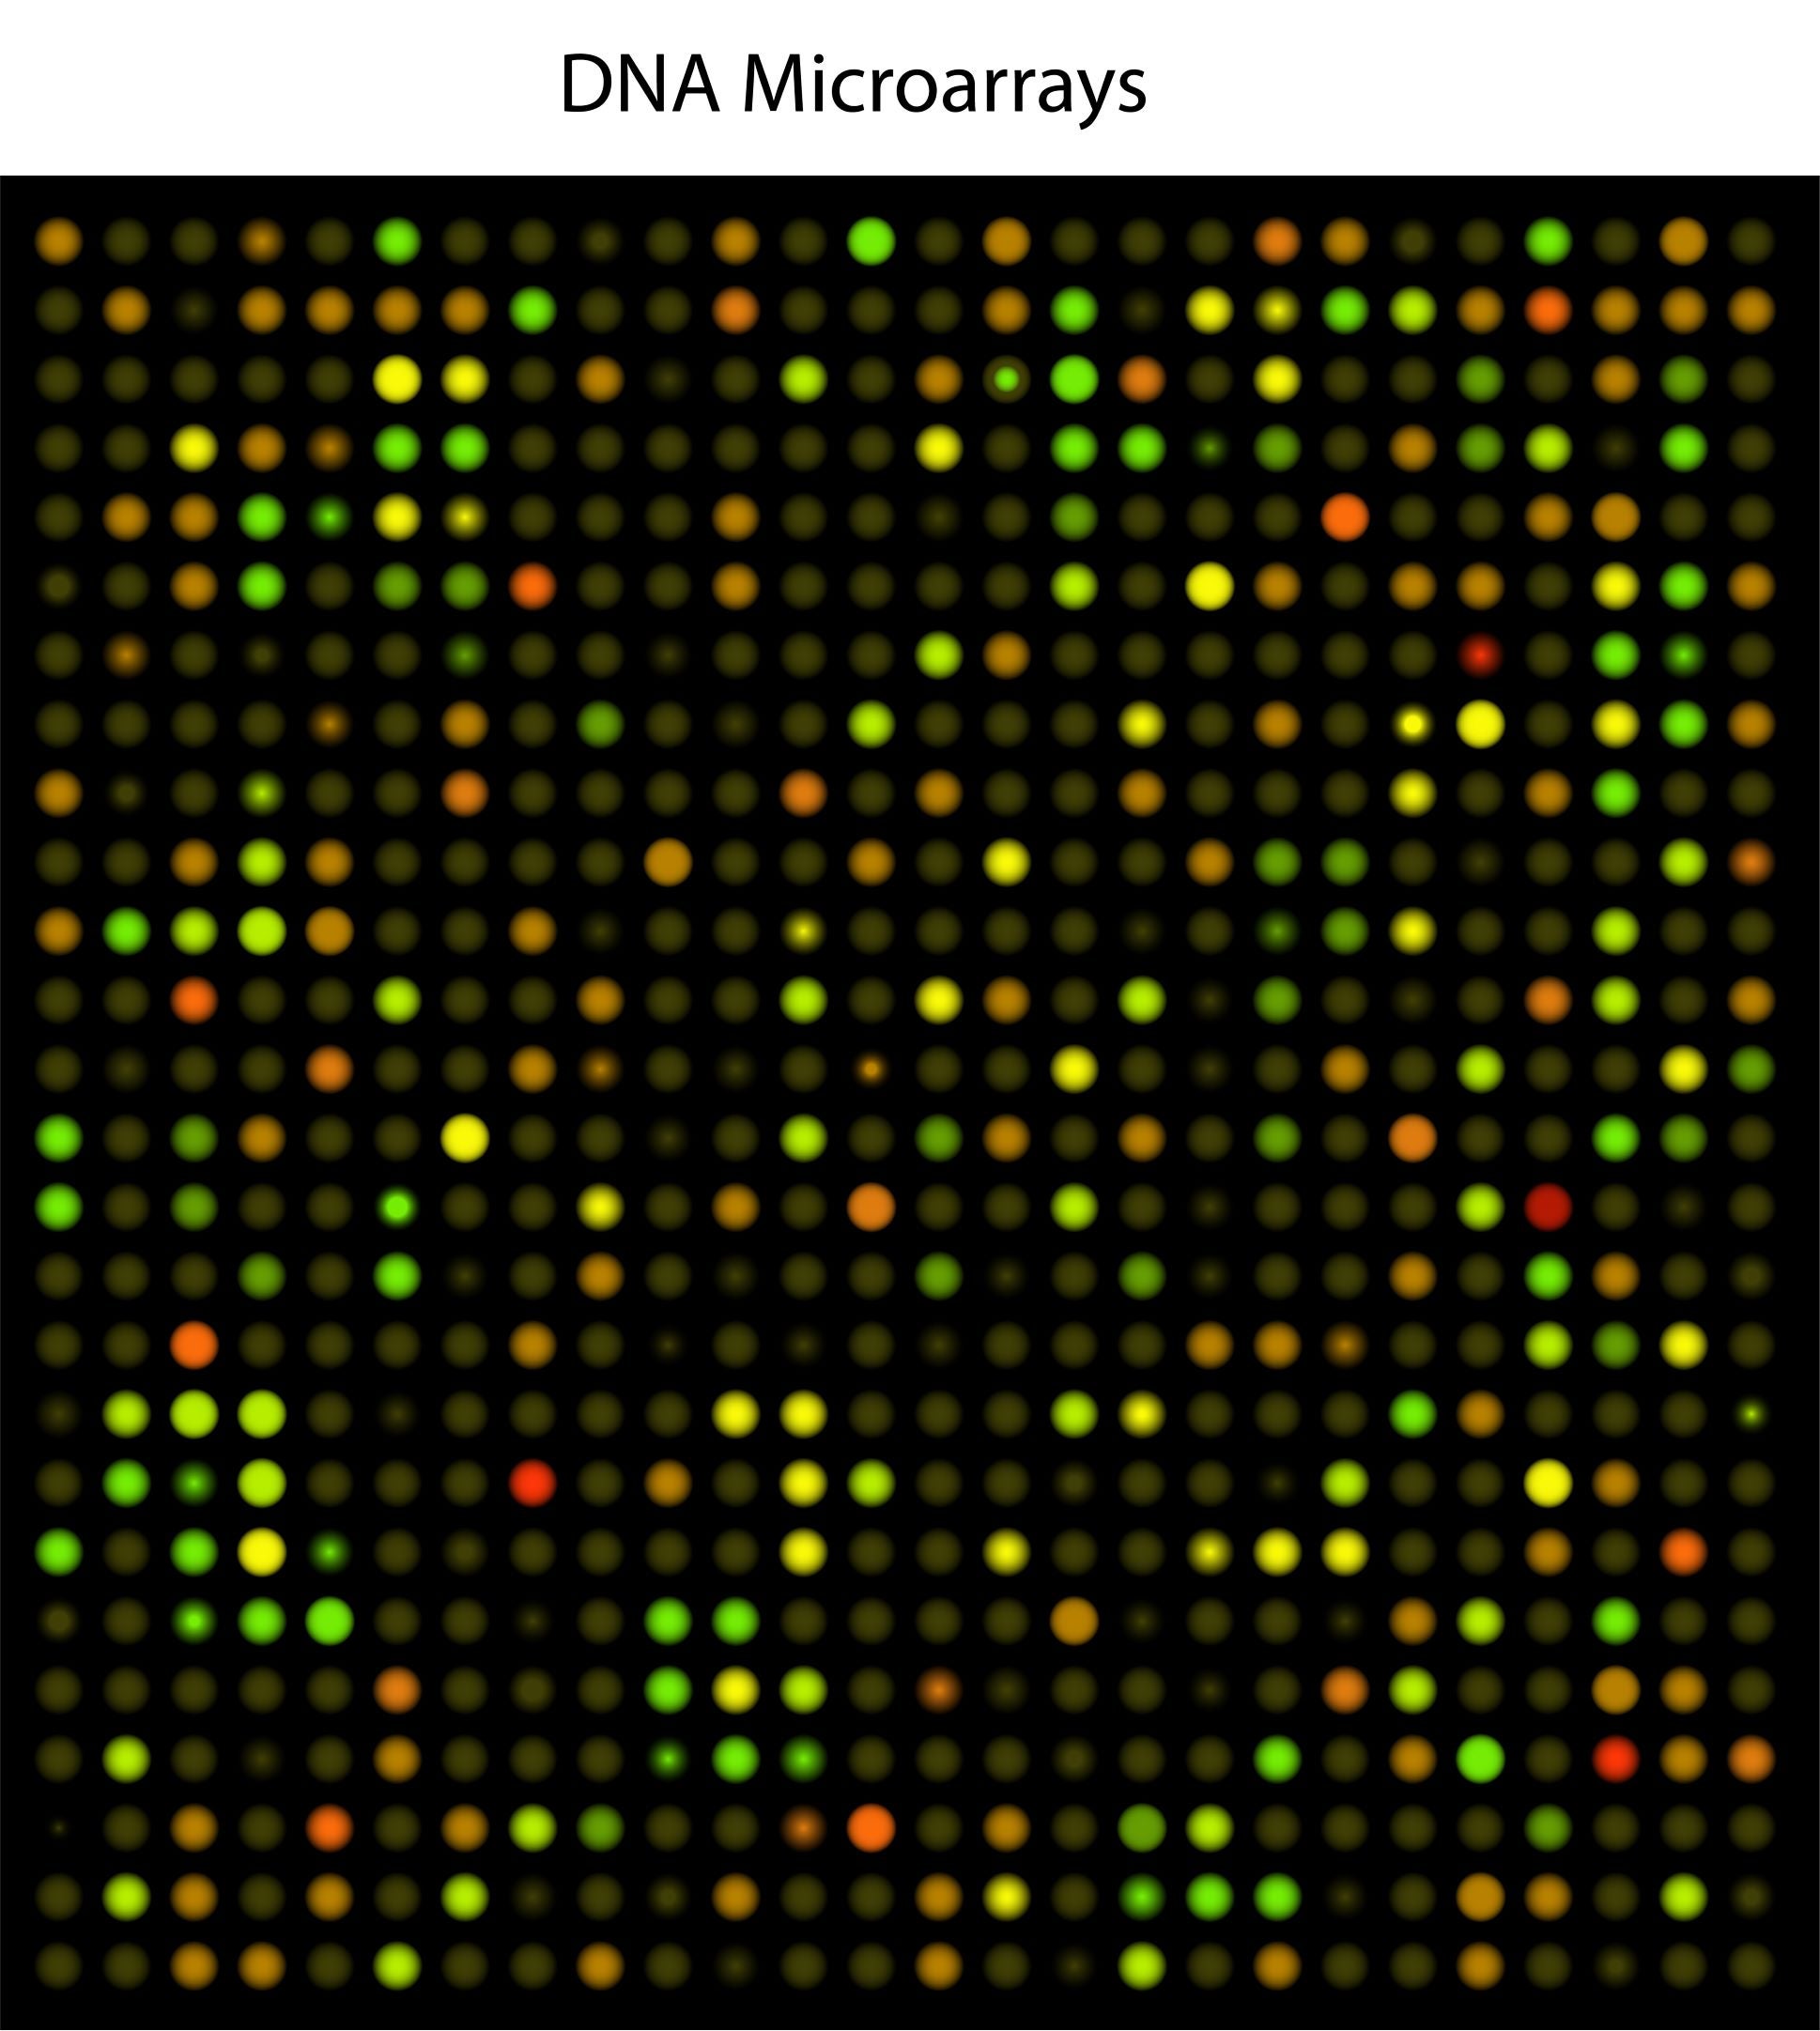
By 1995, researchers in the lab of Stanford biochemist Patrick Brown, MD, PhD, a Howard Hughes Medical Institute Investigator, devised a way to study many genes simultaneously by printing those genes onto glass chips. Brown’s team planned to use these chips, which they called DNA microarrays, to find genetic variations in human cells, but they turned out to be a powerful way to study gene activity.
Brown and his colleagues used spots of DNA, each representing a different gene, to detect the RNA molecules that cells produce when those genes are turned on. The RNA molecules produced by each cell are used to produce fluorescently-labeled cDNA molecules, which are then exposed to the DNA probe on the chip. Each DNA probe produced a fluorescent signal when it was bound to its corresponding cDNA, and by monitoring fluorescence on the chip, scientists could measure how much each gene was being used. The technique takes advantage of the complementary nature of DNA and RNA, building on a method developed in 1975 that uses similar principles to screen colonies of bacteria for specific DNA sequences. The team built a robot that transferred DNA onto glass slides so that thousands of genes could be represented on a single microarray.
A similar technique had been developed early on at the biopharmaceutical firm Affymax (later called Affymetrix), where Stephen Fodor, PhD, and his colleagues synthesized DNA directly on glass chips. To build DNA strands with specific sequences, Fodor’s team used photolithography, a method developed for the manufacture of circuit boards and silicon chips, to chemically link together DNA building blocks one letter at a time.
By 1997, Brown’s team had used a single microarray to monitor virtually every gene in yeast as the cells shifted between different modes of metabolism. It was the first analysis of a complete gene expression profile of a eukaryotic genome—an important step toward generating a transcriptome, the full set of RNA molecules in a cell.
Microarrays were quickly adopted by the research community after Brown and his then doctoral student Joe DeRisi shared their methods, teaching others how to synthesize the tools in their own labs. “We thought everybody should be able to get access to this, not just rich pharmaceutical companies,” says DeRisi, who completed his PhD with Brown and today uses genomics to study infectious diseases at the University of California, San Francisco. “We put a guide on the web, so that anybody can build the robots themselves, then our protocols and everything.
“Gene expression experiments and transcriptome levels of whole genomes took off like a shot,” he continues. “It just exploded.” As the technique spread, researchers found thousands of creative ways to use it, adds DeRisi, who in his own lab developed a microarray for viral discovery that he used in 2003 to identify the virus that caused that year’s SARS outbreak. (DeRisi is also co-president of the Chan Zuckerberg Biohub, a research collaboration among the University of California, San Francisco; the University of California, Berkeley; and Stanford University.)
Initially, DeRisi says, Brown’s team encountered significant skepticism about their ambitious idea. “We’d meet some biologists who’d say, ‘I don’t understand why it would be useful to measure more than one gene at a time,’” he recalls. Now, he says, profiling complete transcriptomes has become an expected component of molecular biology.
All In On Omics
These days, however, researchers usually turn to even newer technology to study transcriptomes. One of the pioneers who ushered in a new phase of transcriptomics is Michael Snyder, PhD, the director of genomics and personalized medicine at Stanford’s School of Medicine. Currently, Snyder is leading a Stanford study monitoring the “omes”—not just transcriptomes, but seven other sets of data, from proteomes to genomes of patients and microbiomes—of 100 individuals as they change over time, looking for patterns that correlate to health or illness. That study laid groundwork that allowed his team and their collaborators to quickly deploy wearable technologies to look for signals of SARS-CoV-2 infection. In fact, he’s been deeply involved in developing and using omic technologies for decades.
DNA sequencing can be used to study a cell’s RNA thanks to an enzyme called reverse transcriptase, which was discovered in cancer-causing viruses in 1970 by both the University of Wisconsin-Madison’s Howard Temin, PhD, and the Massachusetts Institute of Technology’s David Baltimore, PhD—a discovery that won them a share of the 1975 Nobel Prize in Physiology or Medicine.
In the 1990s, Snyder, who was then on the faculty at Yale University, began conducting large-scale gene analyses by using mobile genetic elements called transposons to tag and follow thousands of genes. In 2008, he was one of the first scientists to take advantage of efficient next-generation sequencing technology to comprehensively analyze all of the RNA in a population of cells. The method was born out of frustration. “Some of this stuff gets invented by sort of necessity,” he says, “recognizing there’s a gap and we’re having trouble, and if we’re having trouble, everybody must be having trouble—so there’s got to be a better way.” His team at Yale had been trying to identify the edges of genes within the yeast genome, to better understand how genetic information is organized and to create a map that would facilitate studies of gene regulation. Initially, they tried analyzing each gene individually, beginning with a snippet of its known sequence. When that didn’t pan out, they worked backward, analyzing the RNA produced from active genes instead of focusing on the original DNA code.
DNA sequencing can be used to study a cell’s RNA thanks to an enzyme called reverse transcriptase, which was discovered in cancer-causing viruses in 1970 by both the University of Wisconsin-Madison’s Howard Temin, PhD, and the Massachusetts Institute of Technology’s David Baltimore, PhD—a discovery that won them a share of the 1975 Nobel Prize in Physiology or Medicine. Overturning molecular biologists’ assumption that genetic information always flowed from DNA to RNA, Temin and Baltimore (the latter a senior science advisor for the Science Philanthropy Alliance) found that some viruses use reverse transcriptase to produce DNA copies of RNA molecules. Scientists now use the viral enzyme to do the same thing in their labs.
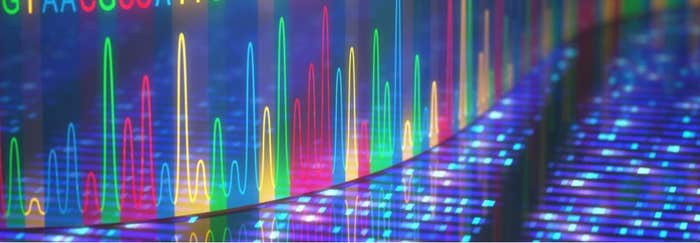
In a method that Snyder’s team called RNA-Seq, reverse transcriptase is used to convert the RNA inside cells into DNA copies. These DNA sequences are then amplified and sequenced. Snyder’s lab used RNA-Seq to map the transcriptional products of the yeast genome, while other teams were developing a similar approach to investigate chemical modifications that influence gene activity in plants and to explore in mice how different tissues use the genetic code. Other biologists quickly recognized the power of the technique, which can assess all the gene activity in a set of cells, including genes not previously identified. That means researchers can obtain a comprehensive snapshot of gene activity, even in a newly discovered species or a novel virus (like SARS-CoV-2).
Pushing The Technique To Its Limits
Initially, researchers needed millions of cells to generate enough genetic material for transcriptomic analyses. But as new molecular methods became available, biologists began to push the technique to its limits, coaxing transcriptomic data out of fewer and fewer cells.
“At the time,” Teichmann says, “scaling these technologies to the whole human body really seemed completely crazy.”
M. Azim Surani, PhD, a developmental biologist at Cambridge University in England, wanted to understand how genes are used during the earliest moments of life, when a fertilized egg begins its transformation into a fully formed animal. He didn’t have thousands of cells to work with—the mouse embryos his team was studying were small clusters of cells whose identities changed rapidly as they divided and reorganized themselves. But in 2009, his team managed to profile gene activity in one of these fleeting cell types by measuring the complete transcriptome in a single cell.
These kinds of single-cell experiments began in genetics labs with specialized expertise. Most researchers wanted not just to know how a single cell uses its genes, but also to know, cell-by-cell, how each individual cell in a group uses its genes, often to understand variations within that group of cells. Cell-by-cell studies are crucial for learning how the staggeringly diverse array of cells in the brain work together to process information, for example, or to detect immune cells’ different responses to a pathogen.
As labs around the world deployed single-cell RNA-Seq to interrogate cellular diversity in model organisms like mice, worms, and zebra fish, they developed new methods for amplifying genetic material and tracking its cellular origins, robotic systems for automating these analyses, and computational tools to process vast quantities of sequencing data. Within a decade, biologists had the tools they needed to rapidly analyze the individual transcriptomes of more than 40,000 cells in a single experiment.
Digging Deeper, Thinking Bigger
At the Wellcome Genome Campus in Cambridge, England, researchers in the lab of Sarah Teichmann, PhD, used these tools to study the immune system, zeroing in on specialized sets of T cells to understand their development and behavior in response to infection. Meanwhile, at the Broad Institute of MIT and Harvard in Cambridge, Massachusetts, Howard Hughes Medical Institute Investigator Aviv Regev, PhD, was also using single-cell transcriptomics to study the immune system, uncovering unexpected distinctions among dendritic cells and exploring cellular diversity within human tumors.
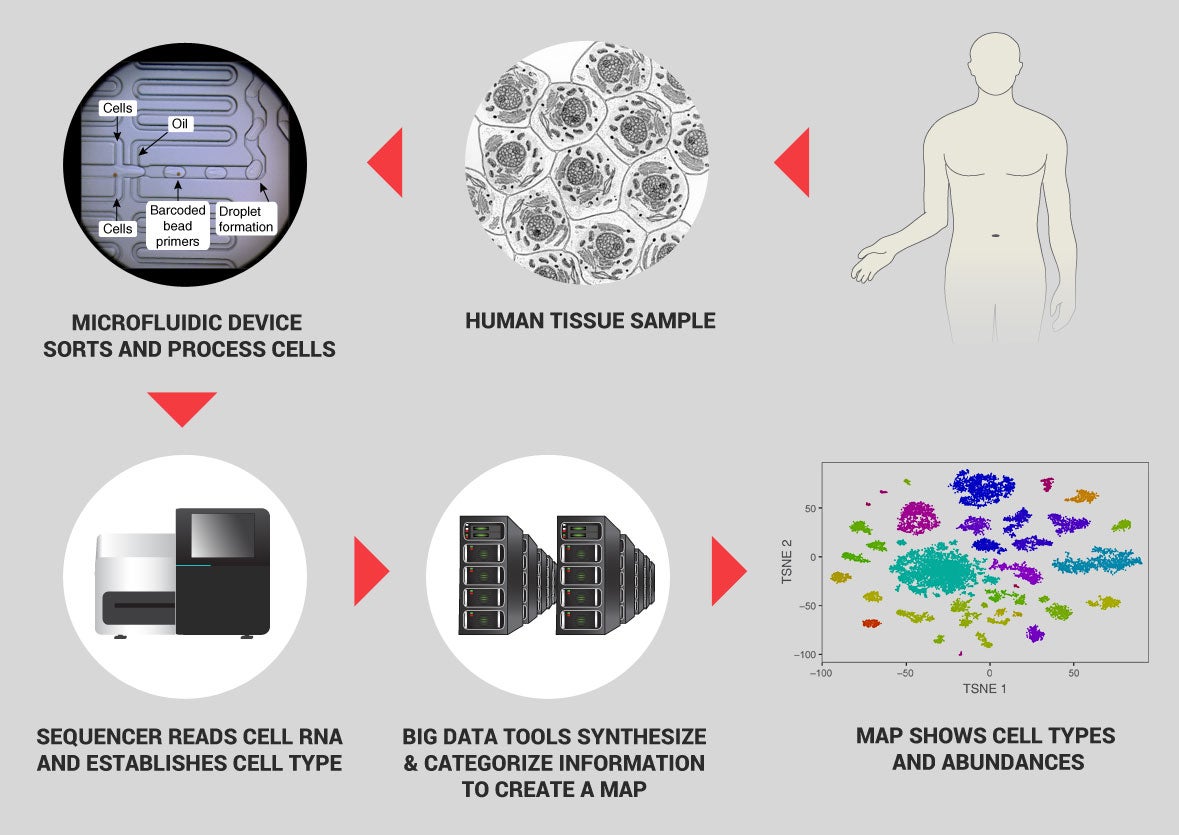
Seeing how these tools were enabling deeper, more nuanced views of the immune system and the brain, Teichmann and Regev began to think bigger. First independently, then as a team, the two scientists envisioned a collaborative effort to use single-cell transcriptomics to systematically profile millions of cells from the human body. In 2014, Regev presented the bold idea of what she called a “human cell atlas” to the U.S. National Institutes of Health. Meanwhile, Teichmann began pitching the idea to colleagues, while her lab studied transcriptomes in mice. “At the time,” Teichmann says, “scaling these technologies to the whole human body really seemed completely crazy.”
But researchers worldwide recognized the potential of such a project to advance science’s understanding of health and disease. In 2016, a grassroots meeting was held at Wellcome’s London headquarters; the scientists attending were so keen on the idea that the Human Cell Atlas (HCA) was launched then and there. The project’s data-sharing platform soon became an essential resource connecting the global community of researchers. Now co-led by Teichmann and Regev, the HCA is building a map of human cells, tissues, and organs. The project is supported by a number of private and government funding sources, including the Chan Zuckerberg Initiative, the Klarman Family Foundation, the Helmsley Charitable Trust, and Wellcome.
With data collection well underway and a robust infrastructure in place for exchanging ideas, the HCA community was ready to spring into action when SARS-CoV-2 emerged in late 2019. Turning to transcriptome data from a wide array of cells, the group found evidence that the receptor that the virus uses to enter cells is produced in the nose, eyes, lungs, gut, and other internal organs. That helped explain some of the clinical manifestations of infection with SARS-CoV-2. For example, Teichmann says, “we weren’t wearing face masks routinely at that time, [and] the loss of sense of smell wasn’t a recognized feature that was specific to COVID-19 at that time. So, the discovery really had an impact on public health and the medical community.”
HCA scientists have since analyzed tissue samples from patients with COVID-19, and Regev expects the data they are collecting now will help scientists understand the long-term consequences of infection with SARS-CoV-2. Other scientists, too, have used transcriptomics to investigate exactly how cells respond to infection. “There are plenty of scientists who study disease with single-cell genomics now,” Regev says. “They’re not focused on the HCA’s mission of cataloging healthy human cells, but they benefit from the lab methods and computational methods. They know the playbook now, and they use it all the time.”
Bringing Chemists’ Tools to Biology
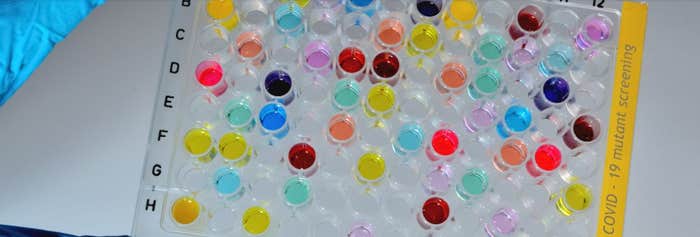
Just as researchers around the world came together to use transcriptome data to better understand COVID-19, a global coalition quickly formed among researchers who were using proteomics and metabolomics to address the pandemic. Supported by three mass spectroscopy societies and seven industry partners, the COVID-19 Mass Spectrometry Coalition is using these approaches to profile patients’ responses to the virus, looking for biomarkers that can help predict the severity of individuals’ disease, as well as decipher cellular-level clues to guide the development of potential therapies.
Their studies depend on a method that chemists have used to analyze complex mixtures of chemicals for a century. Mass spectrometry was invented in the 1890s by British physicist J.J. Thomson during a quest to understand the transmission of electricity through gases. By studying the particles emitted by cathode rays, Thomson discovered the electron (work that won him the Nobel Prize), and in the process an instrument that measured particles’ mass-to-charge ratio was invented.
While Thomson’s instrument was initially used by physicists to investigate the nature of the atom, by the 1940s it had been adopted for industrial applications. Oil companies came to rely on mass spectrometry to characterize the complex mixtures of hydrocarbons in their products. Perfume companies, too, found mass spectrometers useful for tracking the concentration of various scented compounds in their fragrances.
As the instruments became commercially available, chemists began to experiment with them, figuring out how to use the information they generated to decipher the structures of the molecules in a sample. The ionization process in a mass spectrometer converts the sample into charged particles that can be manipulated and sorted according to their mass-to-charge ratios. Excess energy transferred during this process can break some of the molecules into fragments. By the 1960s, three chemists—Fred McLafferty, PhD; Klaus Biemann, PhD; and John Beynon, PhD—had worked out how different molecules fragment, so it became possible to use mass spectrometry to identify unknown compounds.
As chemists developed ways to more gently ionize molecules and keep them stable, mass spectrometry became better suited to studying biological molecules as well as chemicals. A method developed in 1985 by University of Münster scientists Franz Hillenkamp, PhD, and Michael Karas, PhD, using a small laser-activated molecule to transfer energy to molecules in the sample, enabled even large, fragile proteins to be analyzed in a mass spectrometer. When combined with physical separation measures, these ionization approaches make it possible to analyze even extremely complex mixtures. As with Hillenkamp and Karas, Nobel laureates John Fenn, PhD and Koichi Tanaka, PhD and their colleagues, published papers directed toward this feat in 1988.
Combined with information in genomic databases, which can be used to predict the amino acid sequences of proteins, mass spectrometry has now become a powerful tool for profiling the molecules inside cells. As with the tools that enabled transcriptomics, some of the first uses of this approach were to characterize the basic biology of yeast. Scripps Research Institute chemist John Yates, PhD, who pioneered so-called “shotgun proteomics” methods to identify the proteins in complex mixtures, says collaborating with yeast researchers offered opportunities to uncover some interesting biology. As their methods improved, they were able to sort and identify first 1,484 and later more than 4,000 different proteins from yeast cells.
Biologists no longer have to be experts to take on large-scale molecular analyses, “because there is open source code to do the analysis. And there’s a playbook. There are lab protocols, and there are products, and you can just do it now. And that allows you then to apply it really broadly when the need arises.”
Profiling the set of small molecules that make up a cell’s metabolome presents its own challenges, since these molecules are structurally diverse and often less stable than proteins. In 2001, biologists Stephen Oliver, PhD, and Douglas Kell, PhD, at Britain’s University of Manchester and University of Wales captured snapshots of the ever-changing metabolome in yeast cells, using relative concentrations of different metabolites to investigate the role of genes whose functions were previously unknown.
Using these techniques to analyze thousands or even tens of thousands of molecules at a time, biologists are gleaning insight into the processes that drive cells and are also characterizing the responses of humans and other creatures to changing environments.
Crucial Knowledge About COVID-19
Catherine Costello, PhD, the director of Boston University’s Center for Biomedical Mass Spectrometry, says scientists worldwide who use proteomics and metabolomics now share data, methods, and samples on a daily basis as they work to characterize SARS-CoV-2 and its effects. Some efforts have been directed at identifying signs of the virus in different types of patient samples. “There have been studies showing that you can establish the presence of virus in saliva, because some of the key proteins can be detected,” she says. Other studies have reported molecular changes that can be detected by swabbing a patient’s skin. An international team led by Nevan Krogan, PhD, at the University of California, San Francisco, took another approach, using mass spectrometry to identify more than 300 human proteins that interact directly with proteins encoded by SARS-CoV-2. Their map of these host-virus protein interactions suggests points at which potential therapies might be able to intervene in the virus’s attack on those infected with it.
As researchers continue to churn out vital information about COVID-19, Aviv Regev notes that the scientific community has been empowered by the tools it has developed and disseminated in recent years. “That’s a legacy that we learned in the Human Genome Project, which is kind of the grandfather of all these projects: techniques are extremely liberating for biologists,” she says. Biologists no longer have to be experts to take on large-scale molecular analyses, “because there is open source code to do the analysis. And there’s a playbook. There are lab protocols, and there are products, and you can just do it now. And that allows you then to apply it really broadly when the need arises.”